

Tapio Analysis service · paper, board, tissue and nonwovens
Troubleshooting, diagnosis and quality comparison
Send us machine-direction (MD) sample rolls or cross-direction (CD) strips. We measure them on our own Tapio Analyzer, find where the variation is and what is likely causing it, or compare samples with identical settings, and go through the findings with you. Samples are measured within two working days of their arrival.
A service: we measure your samples in our laboratory in Espoo and interpret the results with you. Want to measure in your own laboratory instead? See Tapio Analyzers.
What to use Tapio Analysis for
Tapio Analysis is high-resolution same-spot variation analysis of paper, board, tissue and nonwovens: far more detailed than point-like laboratory tests or online measurements can show. Your samples are measured on a Tapio Analyzer with basis weight, caliper, transmission, ash and gloss on both sides aligned to the same positions on the sheet, and the Tapio software connects the observed variations to known frequencies of the production line: rolls, felts, wires, pumps and actuator spacings.
Because the channels line up, the channel a variation appears in points to where it was made. Variation in the mass points towards the wet end, variation in thickness alone towards pressing or calendering, and variation on one face towards that surface.
The same measurement compares machines, grades, suppliers or conditions on identical terms. A fault is often found by comparing a known problematic roll with a non-problematic one and looking at what differs between them.
MD analysis and CD analysis
Every project is one or both of these. Send the samples for the direction your question is in; we confirm which with the scope.
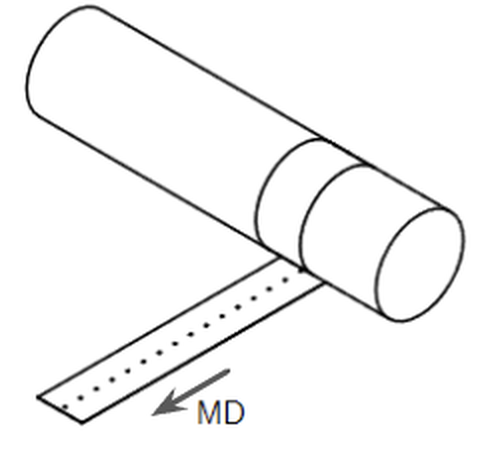
MD analysis: along the web
You send one or more MD sample rolls, cut at the winder. We measure the full roll with millimeter-level resolution to see how each quality parameter varies along the sample, and the head of the roll at the finest resolution for formation and fine structure. We then study the channel data to determine where the variations are coming from and whether their level is normal.
It answers: periodic variations (defective rolls, calenders, felts, wires, barring, pressure pulsations, screens, pumps), which machine elements could be behind a peak, winder vibration, and how a machine, grade or trial compares with another or with our archive.
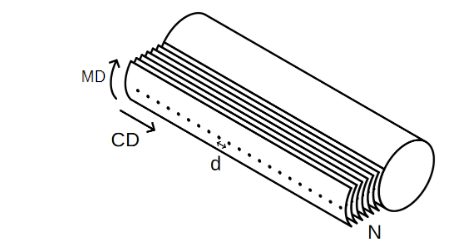
CD analysis: across the web
You send full-width CD strips from one parent reel; hand-cut strips are fine. We measure every strip straight across, edge to edge. The mean profile shows the repeatable CD variation with a confidence band from the strip-to-strip spread, the CD spectrum is marked with your actuator spacings, and your scanner profile can be laid over ours.
It answers: CD profile problems, streaks, soft or hard edges, actuator-scale variation, what a traversing scanner averages away, comparisons between reels, grades or machines, and CD profile stability (variance component analysis).
Typical questions
| What you see | What to send | What the analysis shows |
|---|---|---|
| Barring, or periodic marks along the web | MD rolls, ideally one from a period with the problem and one without | The wavelength, which channels carry it, and the candidate machine elements it matches |
| Winder vibration, wobbling reels, uneven roll diameters | MD rolls, and CD strips if the reels differ across the set | Periodic thickness variation that can build up in the roll, and candidate rolls or fabrics behind it |
| CD profile problems, streaks, soft or hard edges | CD strips, and your scanner profiles | CD profiles measured straight across the web, including the edges, actuator-scale variation, and our profile against the scanner's |
| A sheet that varies more than it used to, or more than a sister machine's | MD rolls or CD strips of both | How much more, at which wavelengths and in which properties, and how it compares with earlier measurements |
| Print mottle, gloss variation, formation complaints | MD rolls or CD strips | Gloss on both faces, transmission, formation and floc size, down to short wavelengths |
| A rebuild, a trial or a new supplier to evaluate | Samples from before and after, or from each option | The same statistics and spectra for each, computed with identical settings |
Describe the situation and we confirm the sample plan with the scope before anything is shipped.
How the service works
- 01
Describe your case
Tell us about your machine, grade and problem in the request form.
- 02
Get a confirmed scope and quotation
We confirm the scope, the price, the sample instructions and the shipping before you send anything, usually within one working day.
- 03
Send your samples
Prepare MD rolls, CD strips or both as agreed, following the sample preparation instructions, and ship them to our laboratory in Espoo by courier.
- 04
Measurement, report and review
We measure the samples within two working days of their arrival, analyze the data and send the report. Then we go through the findings together in an online meeting. We agree the reporting schedule when we confirm the scope.
What you send
- MD sample rolls, CD strips or both, as agreed in the scope. If you cannot cut rolls to size, send what you have and we arrange the cutting.
- Your question: grade, nominal basis weight and what you have seen.
- Machine data, if you have it: machine speed; roll diameters, fabric lengths and pump speeds for MD; CD actuator spacings for CD; scanner profiles for comparison.
Sizes, numbers and marking: sample preparation instructions. We confirm them for your scope before you ship.
What you get back
In every project:
- the measured data, which opens in the free Tapio Analysis software;
- a written report of the findings, leading with your question;
- an online review of the results with Tapio specialists.
Depending on the scope, for example: a browser report that shows every wavelength in Hz once you type in the machine speed and prints to PDF, the figures and a table of every number quoted, a raw data report of every roll and channel, and a slide deck of the findings. We confirm the deliverables with the scope.
A matching wavelength or a strong correlation is evidence of a likely source, not proof. Where the measurement cannot settle a question, the report says what would.
Examples
Tapio Analysis is our primary tool to measure and find sources of quality variations that other measuring systems cannot detect. The results show precise machine elements to be fixed or serviced and therefore reduce guessing during production. Tapio Analysis is our primary diagnostics support tool.
Tapio Analysis laboratory measurements reveal real MD and CD variation that online scanners cannot always detect. They are an excellent tool for troubleshooting paper machine quality problems.
MD analysis for machine element contributions and comparisons
How a spectral peak is compared with the rolls, felts, wires and pumps of the machine, and how machines are compared with the same settings.
CD analysis
CD profiles from strips cut straight across the web, compared with the scanner's view.
Barring
Find the barring frequency first, then compare channels to see whether the wet end, pressing or coating is the likely source.
Winder vibration
How periodic thickness variation can build up into an out-of-round roll.
What scanners can miss
Why a traversing scanner's view differs from strips measured in the laboratory.
Porosity profiles
Continuous air-permeability profiles of paper, board and nonwoven grades.
What the results look like
Examples of result and analysis plots used to study the measured data. The views are directly from the Tapio Analysis software.
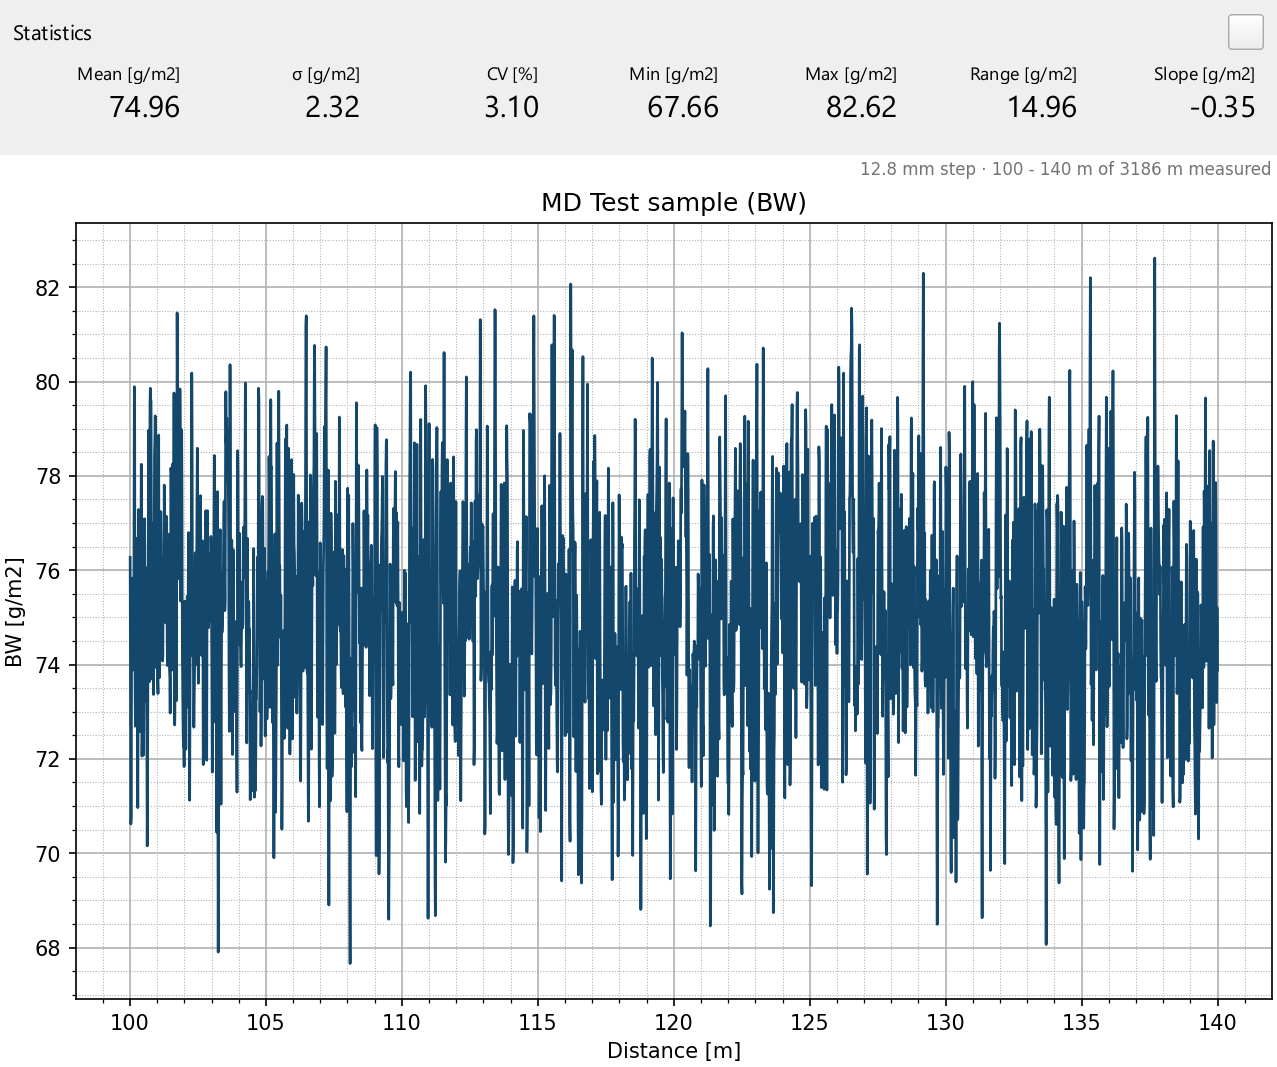
The profile along the roll
MD analysis
Every channel along the roll at millimeter-level resolution, with its mean, deviation, CV and range.
Periodic variation along the roll
MD analysis
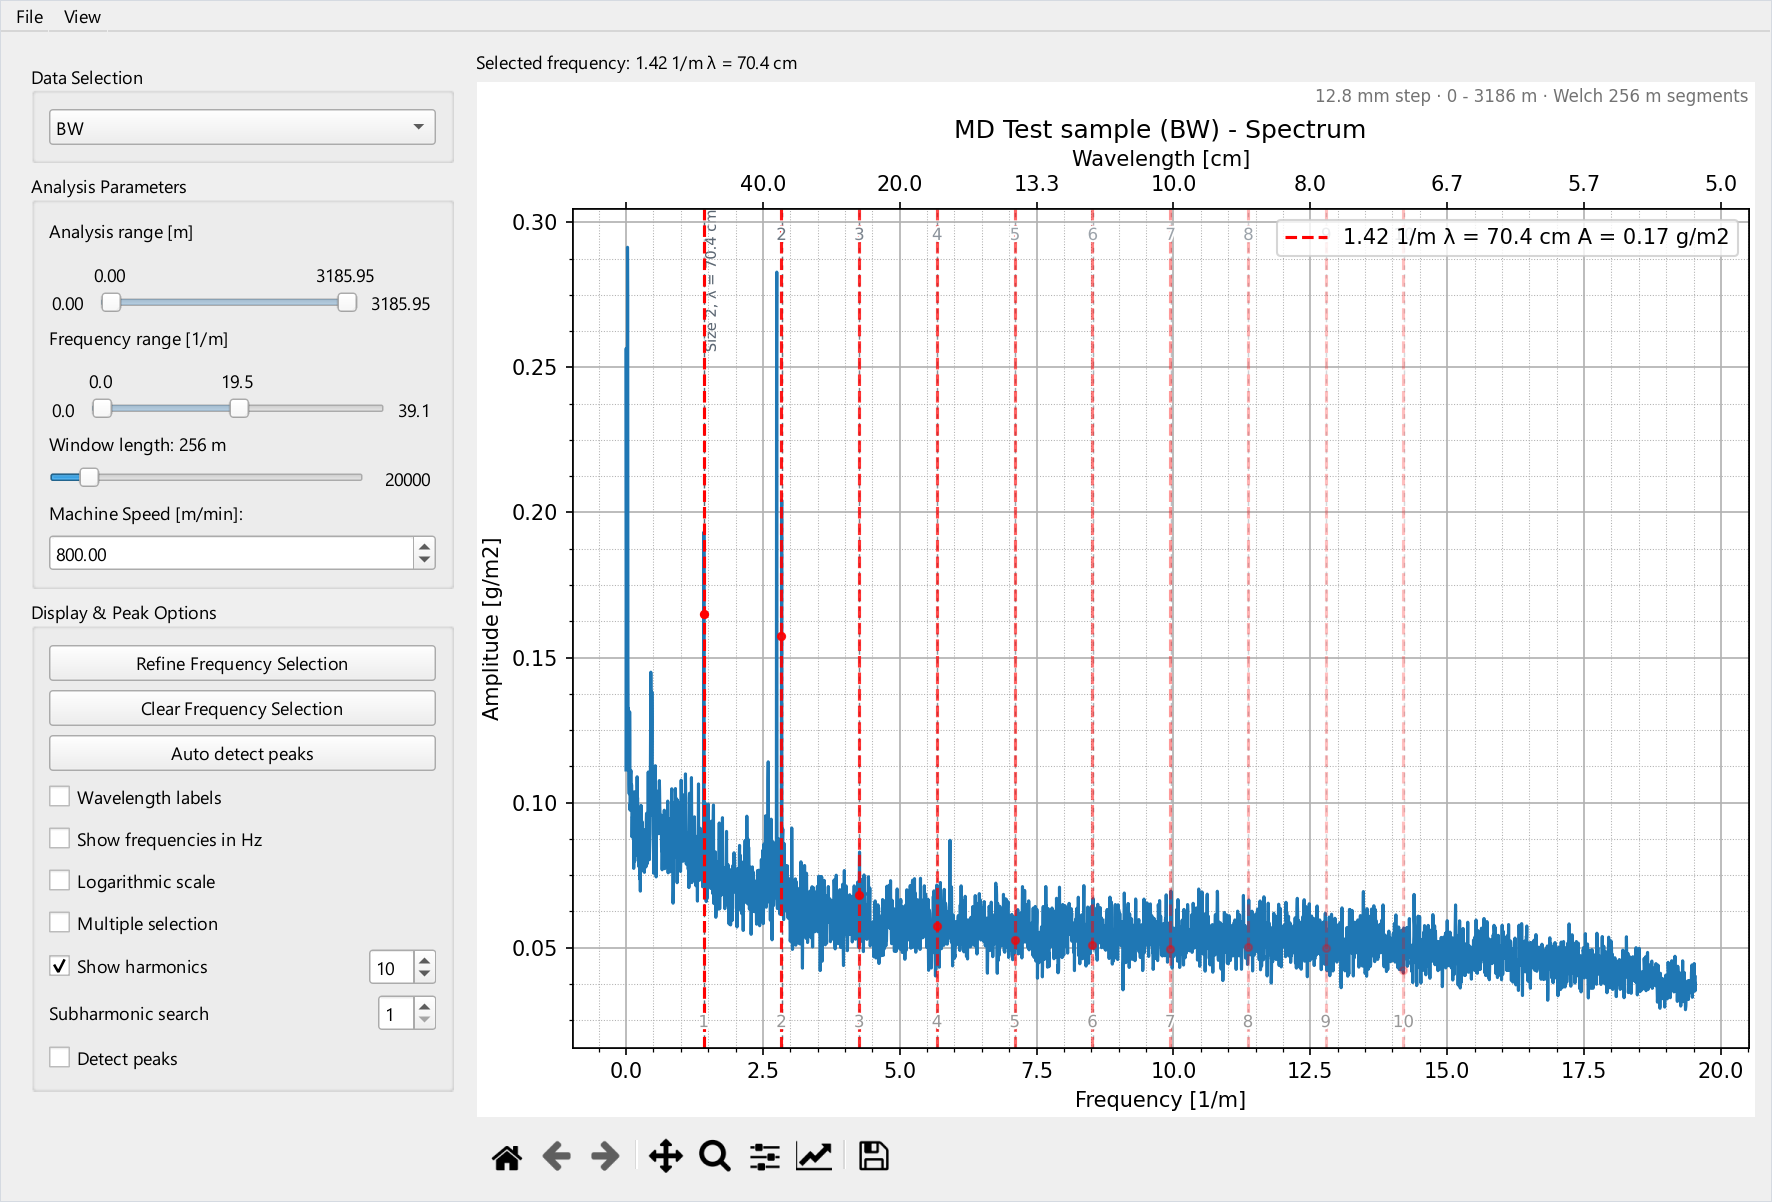
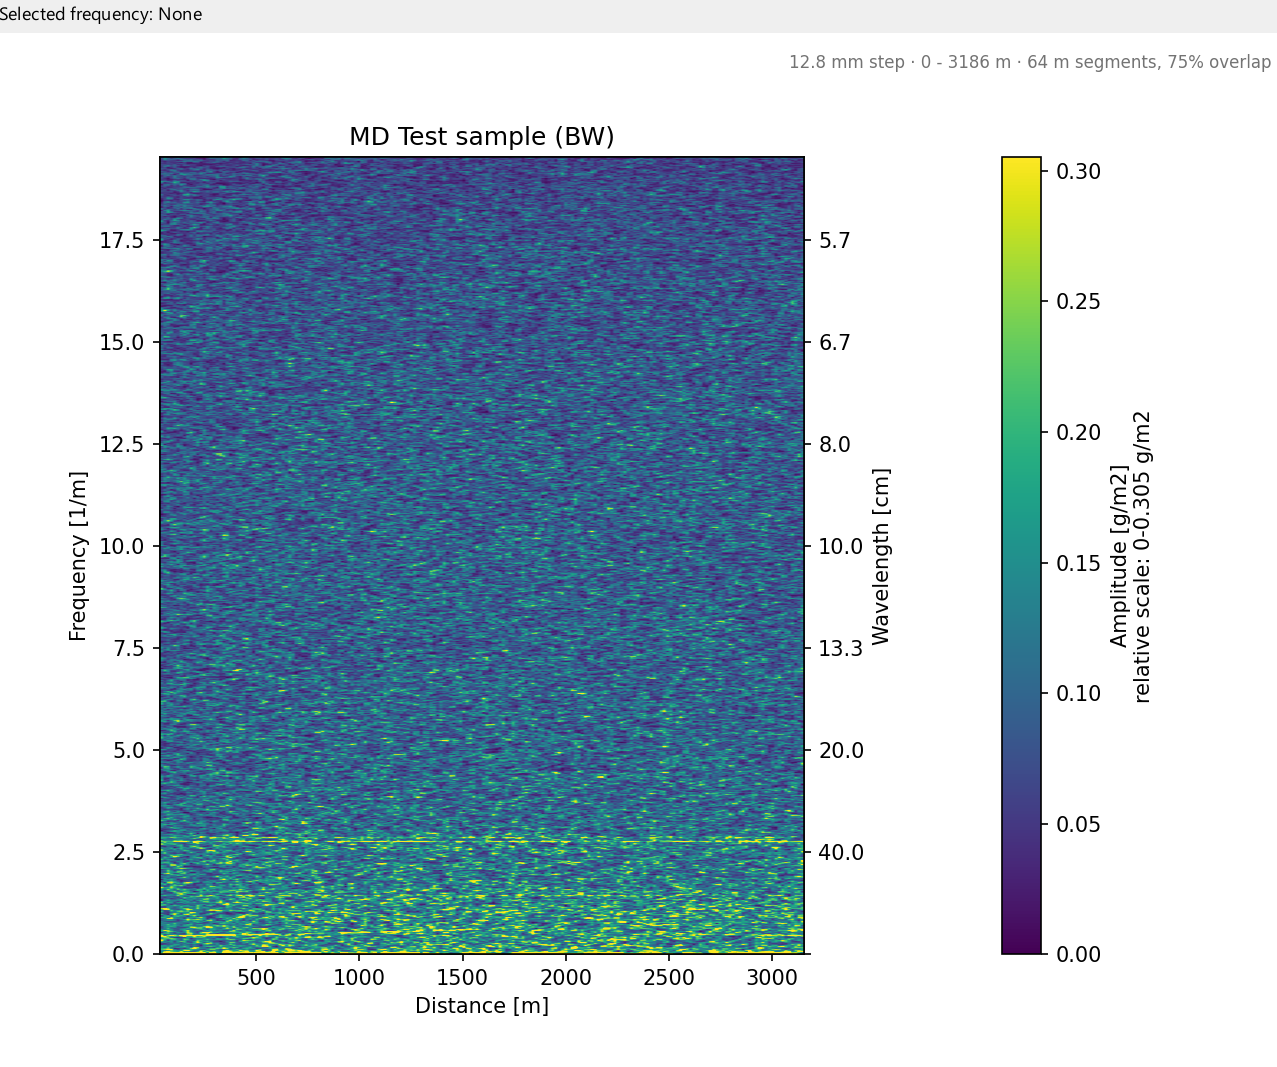
A spectrogram shows whether a periodic component runs steadily along the roll, like the line here, or comes and goes.
The CD profile
CD analysis
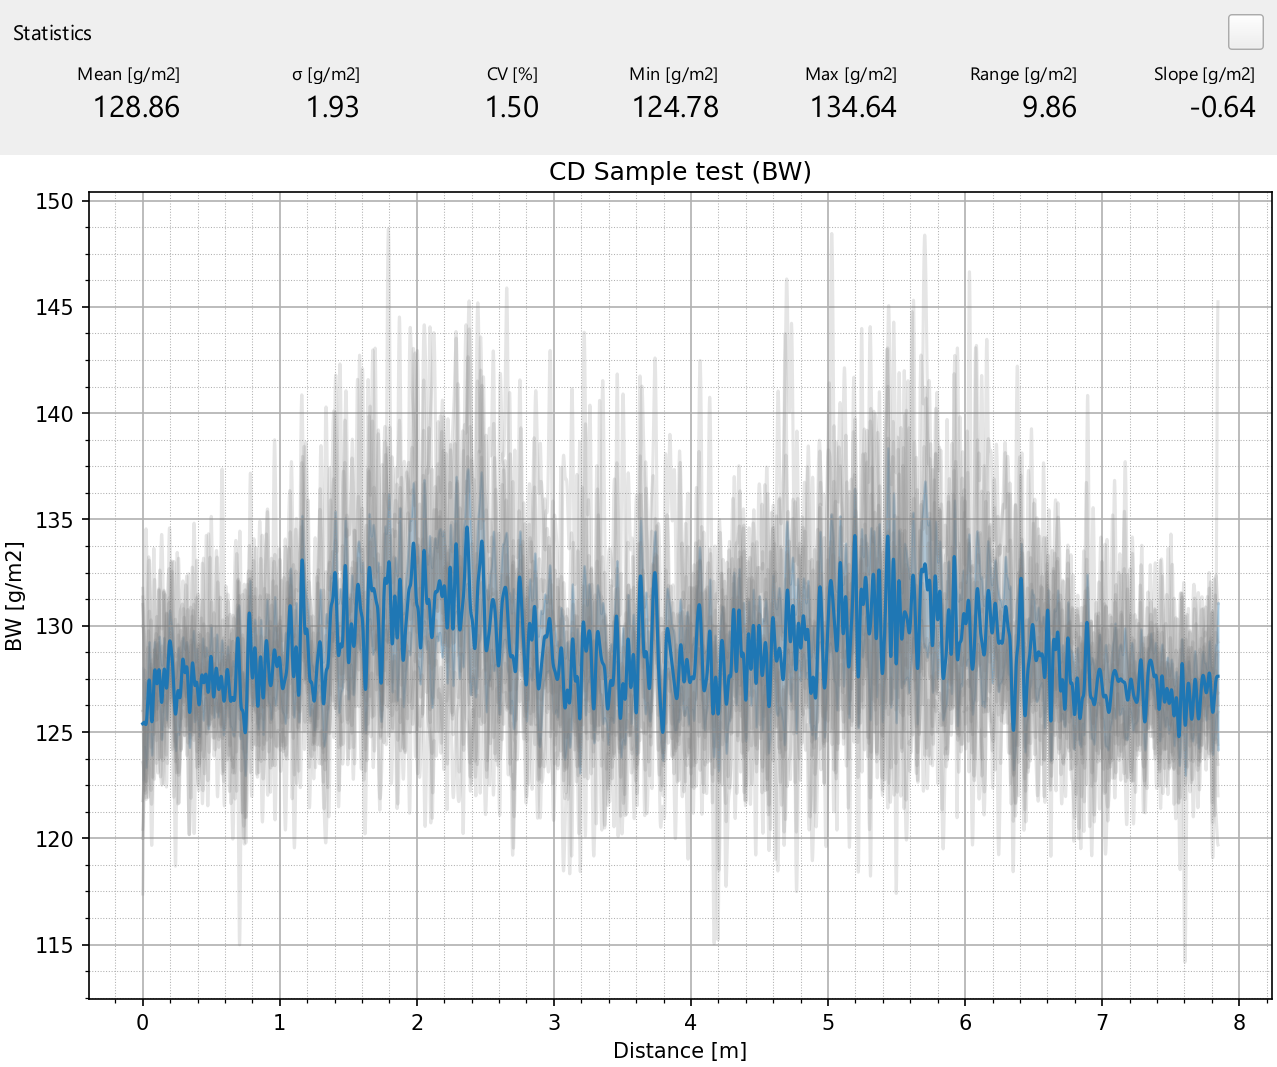
The mean of all strips with its 95 % confidence band. A real CD feature stands out from the strip-to-strip noise.
Every strip
CD analysis
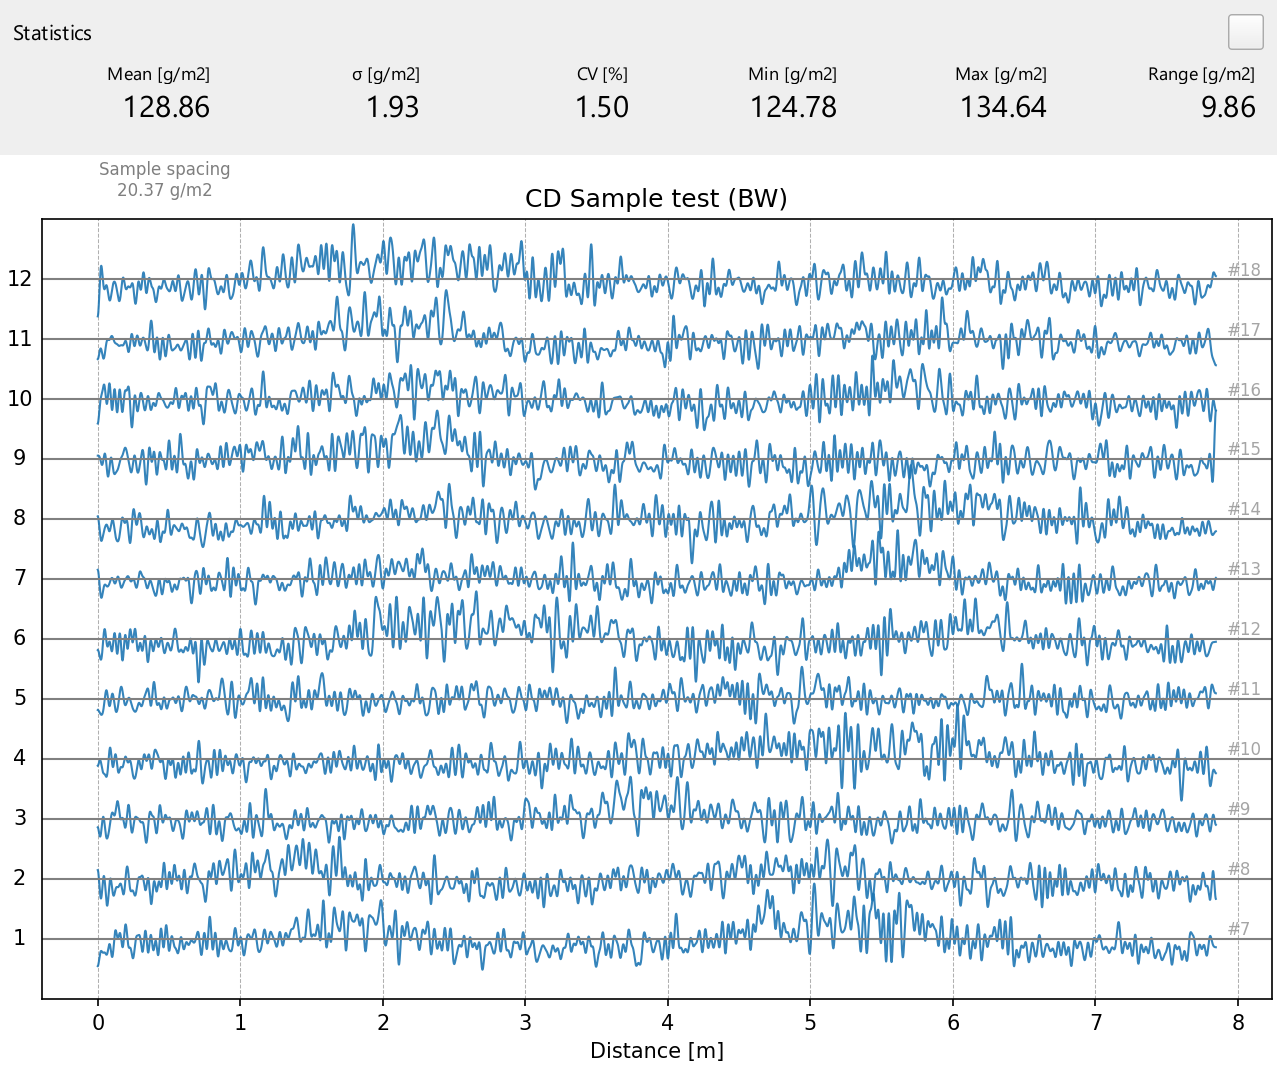
Each strip as its own line. A feature in every strip is a CD feature; a bump in one strip is not.
CD profile stability
CD analysis
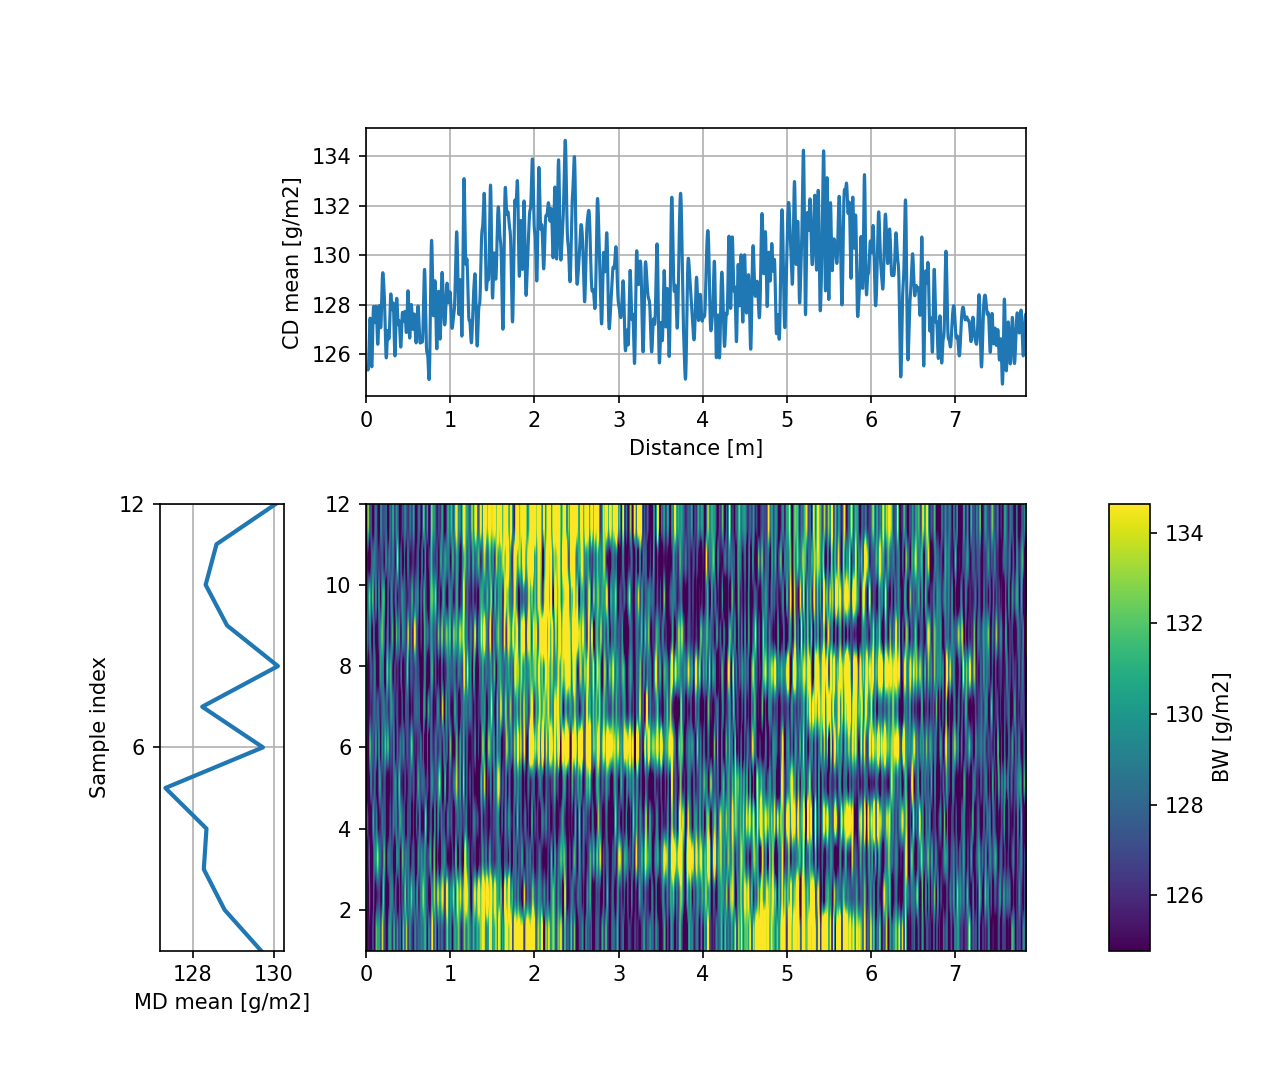
Variance component analysis splits the variation into a repeatable CD part, a strip-to-strip MD part and the rest, which is how the stability of a profile is measured and a machine compared before and after a change.
CD spectrum
CD analysis
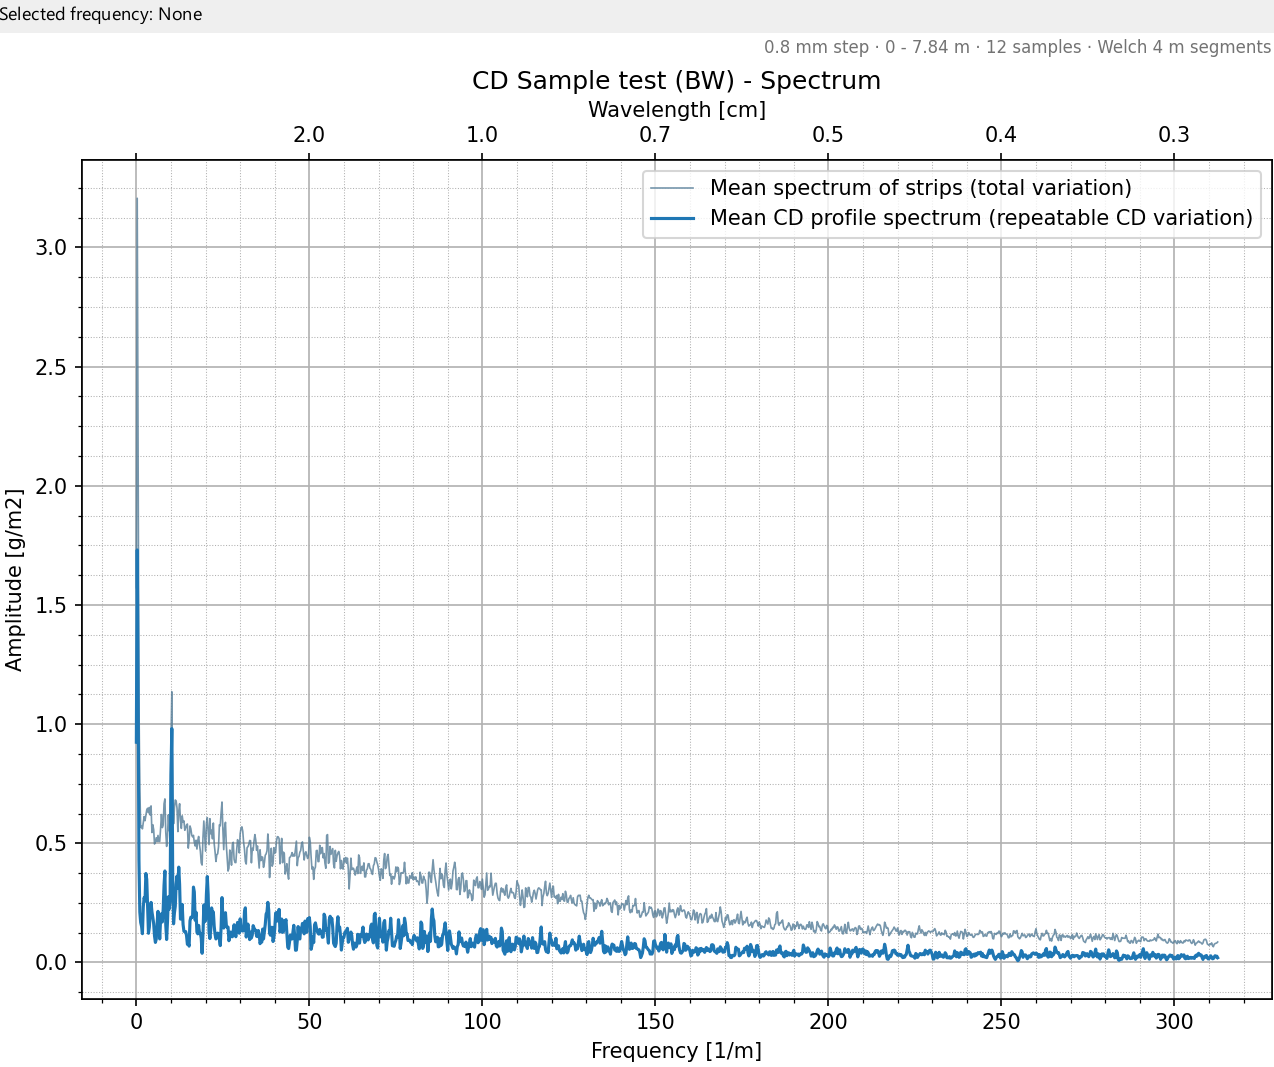
The spectrum of the CD profile shows periodic variation across the web as peaks at their wavelengths. A peak at a regular actuator spacing of the headbox, the coater or the calender points to that actuator row; the repeatable CD variation is drawn separately from the strip-to-strip variation.
Two channels against each other
MD analysis CD analysis
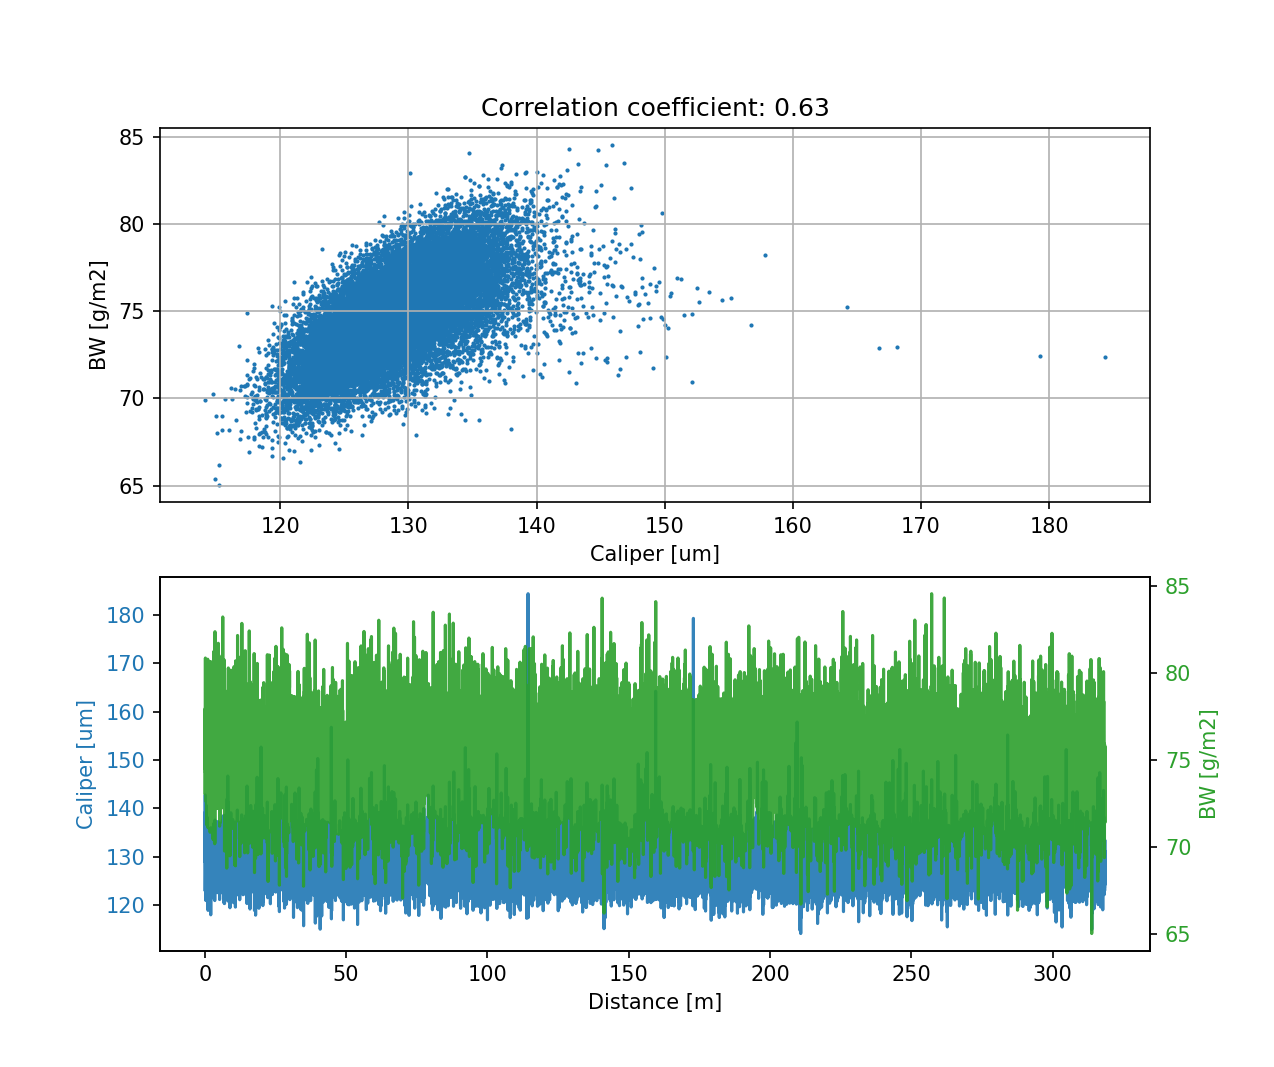
Because every channel is aligned to the same positions, any two properties can be plotted against each other point by point. Here caliper follows basis weight, which says the thickness variation comes with mass variation rather than from pressing alone.
Correlation matrix
MD analysis CD analysis
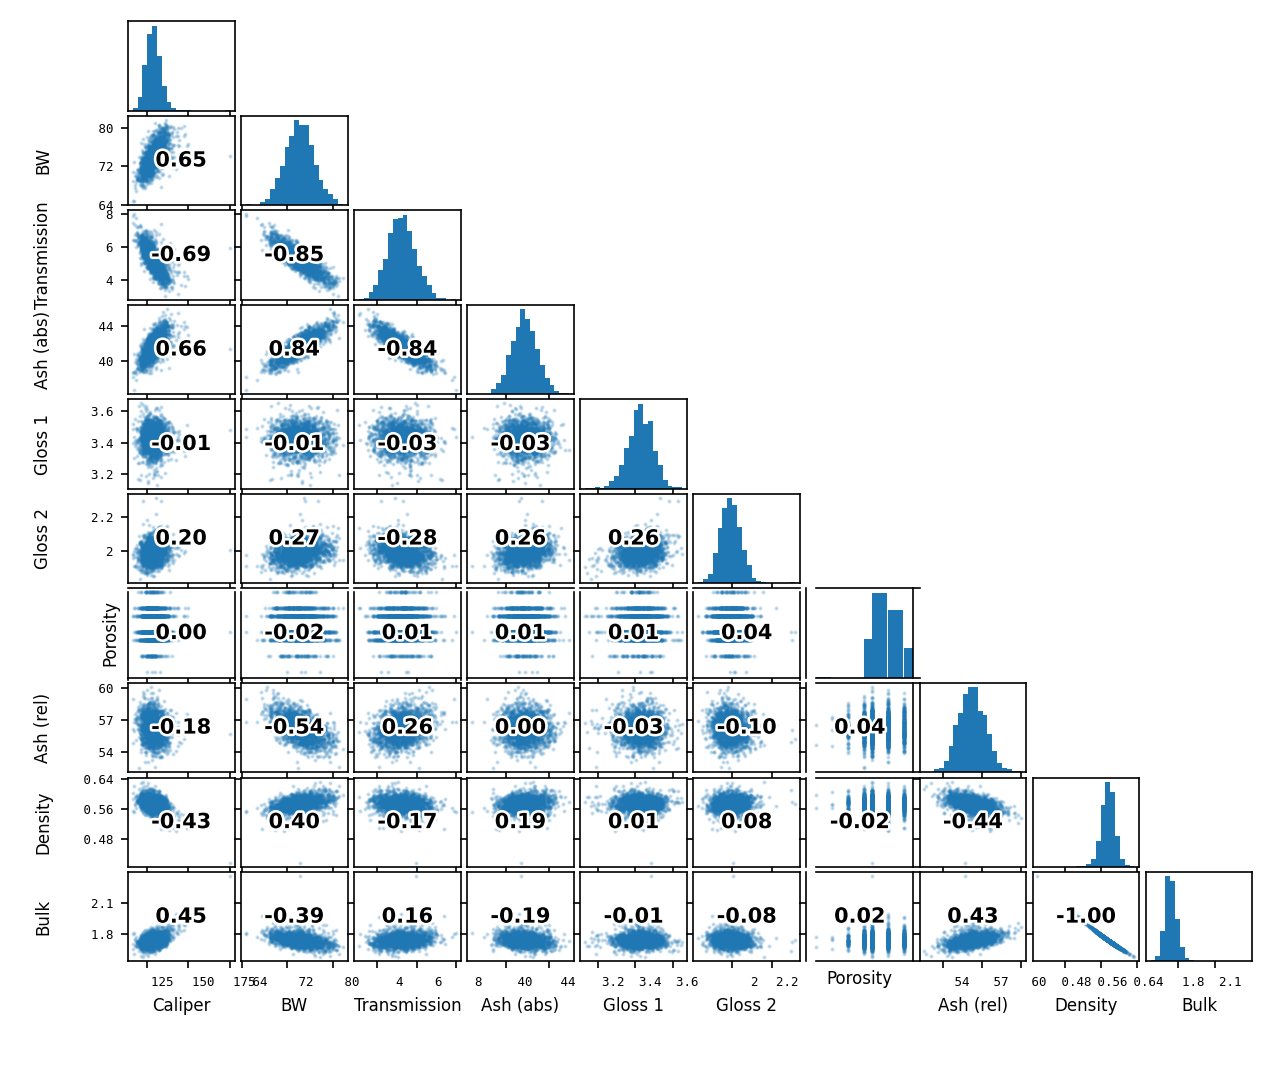
All channels against all channels in one view, measured and derived, with the coefficient for every pair.
Comparison report
Custom report
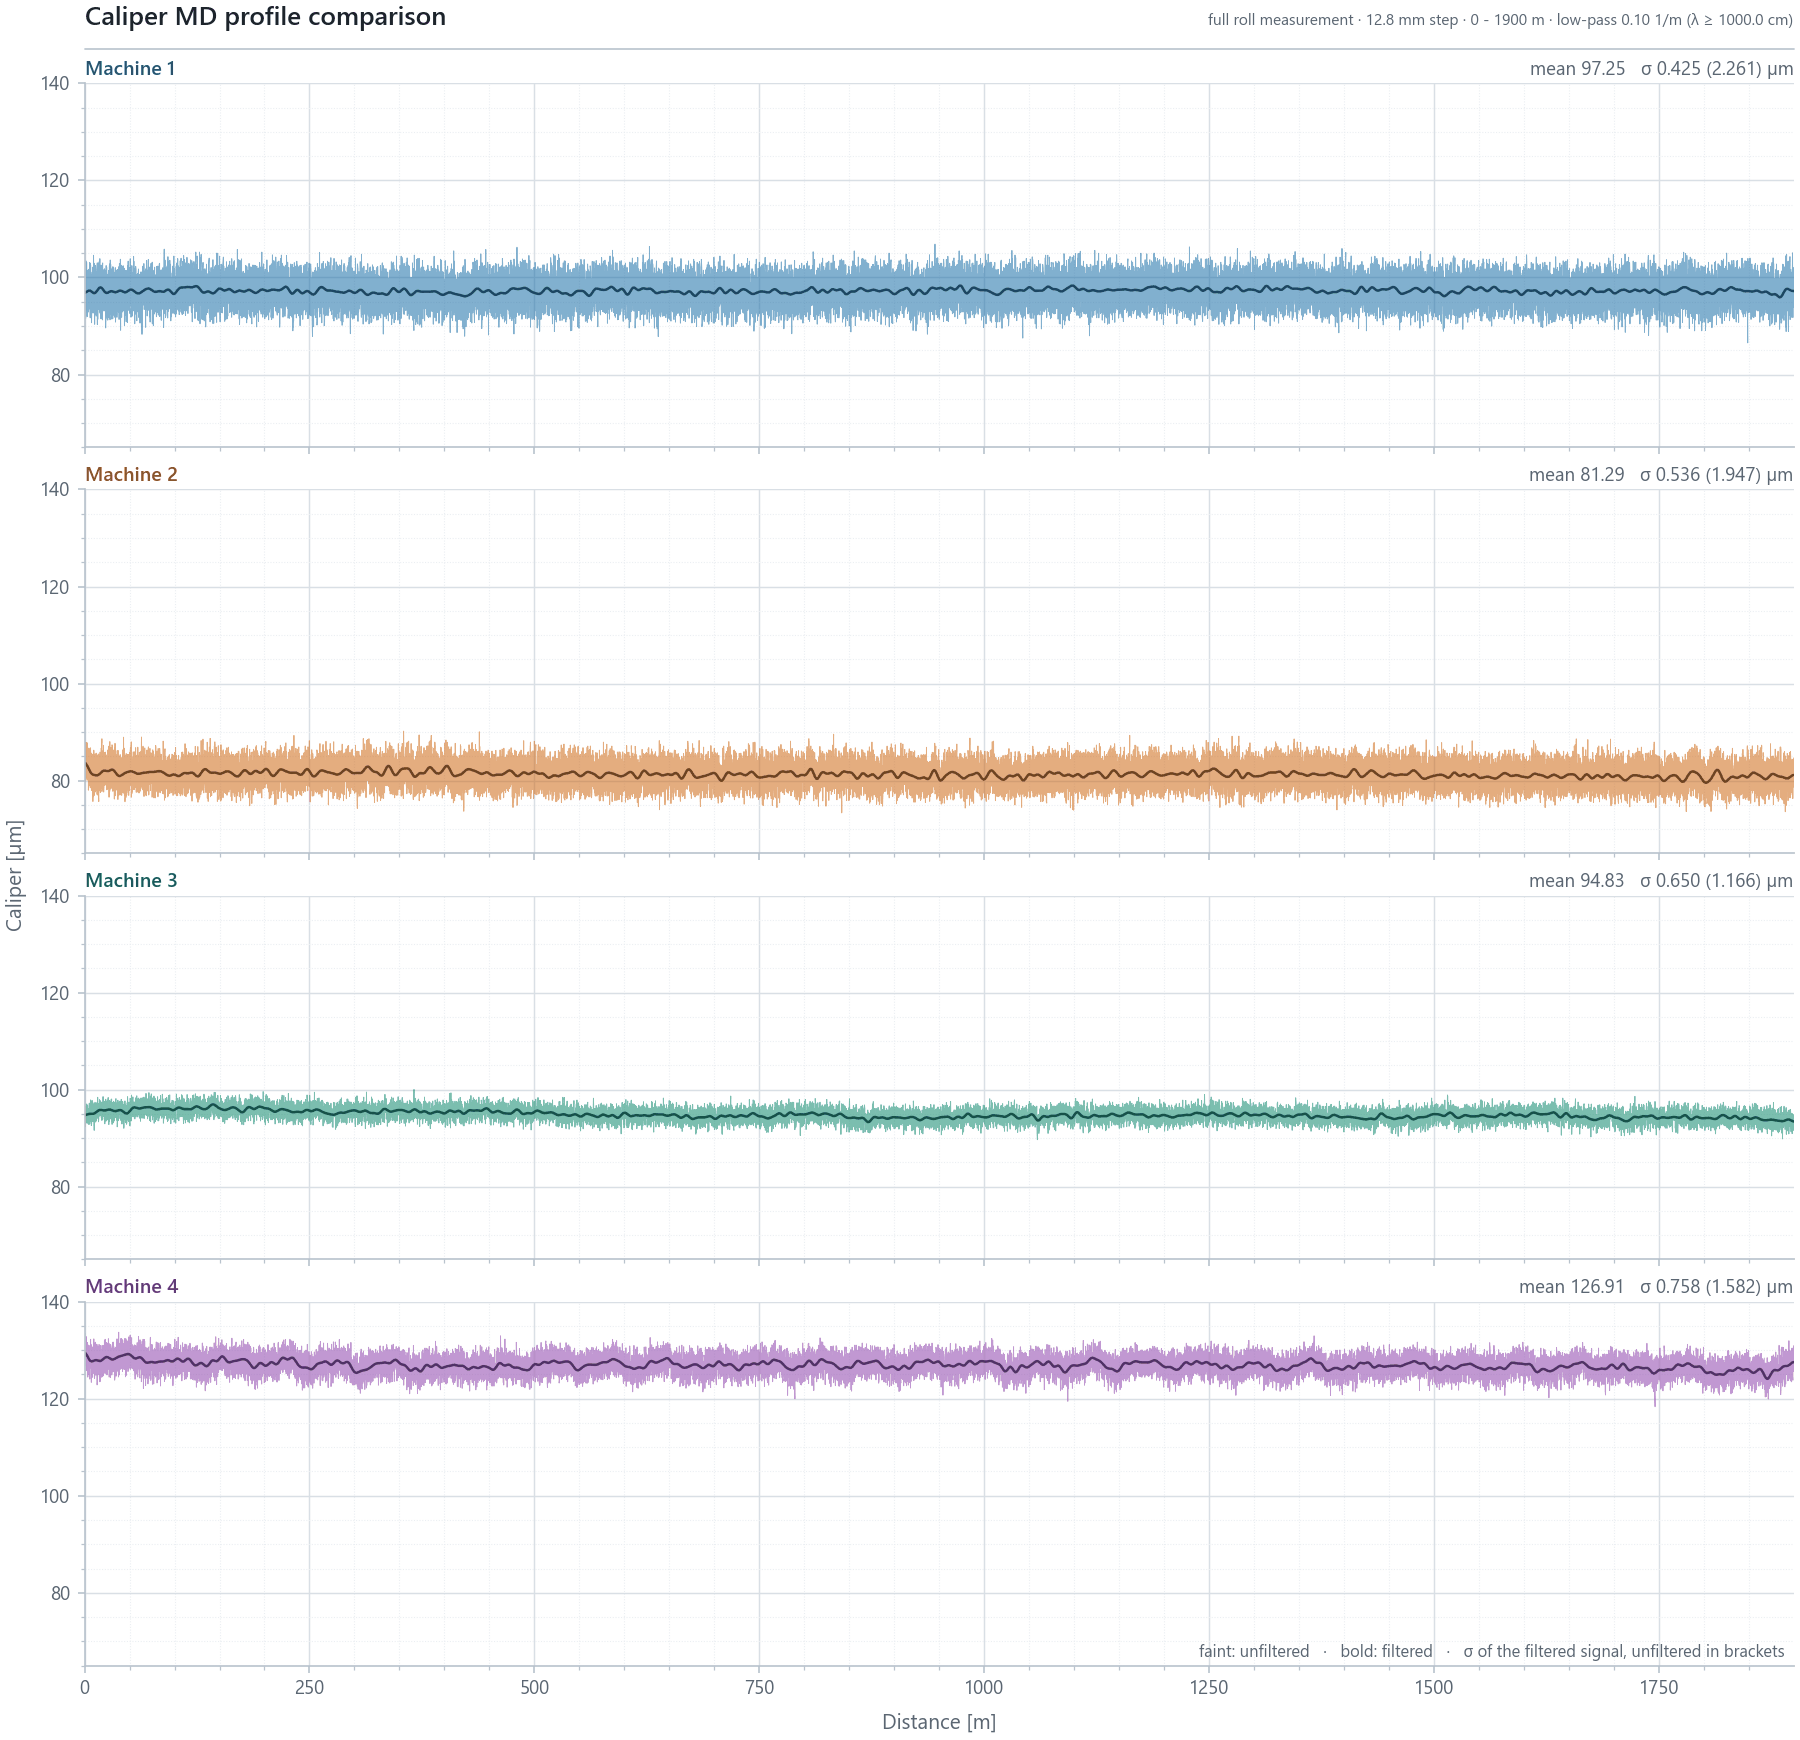
For a comparison of machines, grades, trials or suppliers, the report draws every sample on identical terms: the same length, the same filtering and the same axes, with the statistics beside each. This one compares the caliper of four machines from anonymised archive measurements.
Matching a spectral peak (wavelength in the measured data) to a machine element
In MD samples, periodic variations are often caused by rotating elements in the production line. A periodic variation appears in the measurement as a wavelength; at the machine speed that wavelength is a frequency in Hz, and when the rotating frequencies of the rolls, felts, wires and pumps are known, it can be compared with the elements that could produce it. A roll that leaves a mark once per revolution writes its circumference as the wavelength, so the wavelength divided by π gives the diameter of a roll that could have made it. With your machine data, the Tapio Analysis software draws every element's wavelength over the spectrum and highlights the elements closest to a selected peak.
Caliper spectrum · matching a peak to a machine element
Comparing machines, grades and trials
To compare two or more materials, every record is cut to the same length and every spectrum computed with the same settings. Below are the caliper spectra of four anonymised machines. A periodic source shows as a single sharp peak above the broadband floor; a sheet that varies more overall lies above the others across the whole band.
Caliper spectrum comparison · four machines
Benchmarking against the Tapio measurement archive
A comparison of four samples tells which of the four is different, but not whether any of them is unusual. For that, each channel's coefficient of variation can be set against Tapio's archive of earlier measurements, matched on measurement direction, grammage class and record length, because a coefficient of variation grows with the length of the record. Each violin below is the spread of the archive for one channel, and each dot is one machine. A dot at the far left is steadier than almost everything in the archive; a dot at the far right varies more than almost everything.
Variation against the measurement archive · CV %
Scope and limits
| Tapio Analysis service | |
|---|---|
| Materials | Paper, board, tissue and nonwoven grades; we confirm suitability before you ship |
| Properties | Basis weight, caliper, transmission, ash and gloss on both faces; density, bulk and relative ash derived from them. Remission, and porosity for suitable grades |
| Sampling | 1000 Hz on every channel; an effective measurement resolution of about 1 mm for CD strips measured at 0.1 m/s and about 10 mm for MD rolls at 1 m/s, further limited by each sensor's aperture |
| Timing | Samples measured within two working days of their arrival; the reporting schedule is agreed with the scope |
| Price | Estimate with the pricing calculator; the final price is confirmed before you ship |
| What it can and cannot tell | Where the variation is, at which wavelengths and in which properties, and which sources are likely. A spectral match or a correlation is a lead to check on the machine, not proof |
| Other tests | Tensile strength, elongation and other destructive tests can be added as profiles through our partners, by cutting the samples after the Tapio measurement |
FAQ
How is it different from an online QCS scanner?
A traversing QCS scanner is built for process control. It crosses the moving web on a diagonal path, so machine-direction and cross-direction variation are mixed, and its spot size and averaging smooth the short wavelengths. We measure continuous MD samples and CD strips cut straight across the web in the laboratory, with the channels aligned to the same positions. The two complement each other.
How is it different from ordinary laboratory testing?
Ordinary laboratory tests give single values or averages, often from separate samples. The Tapio sensors follow the same paper testing principles but measure continuous profiles, non-destructively, several properties from the same strip. That makes spectra and direct correlation between properties possible.
What does it show that mean, standard deviation or CV% do not?
Two samples can have the same average and the same CV% and still vary in completely different ways. The analysis shows whether the variation lies at short or long wavelengths, whether it is broadband or periodic, and whether the same variation appears in several properties. That separates random material variation from a repeating, process-related pattern.
Do we need to know the suspected component?
No. We can first characterize the variation as measured. For the likely sources, basic machine data helps: machine speed, roll diameters, fabric lengths, pump speeds and CD actuator spacings. With them, a periodic variation can be compared with candidate elements.
Can the analysis prove the root cause?
It narrows down the likely causes and can point to candidate machine elements, but a matching wavelength or correlation is evidence of a likely source, not proof. The report separates what was measured from how it is interpreted, and recommends what to check next. Before and after comparisons and comparisons between grades or suppliers are useful even when no single component can be identified.
Can you compare our samples with other mills, suppliers or our own QCS?
Yes. We compare total variation, the distribution over wavelengths, periodic components and correlations between properties, and can set every channel against comparable earlier measurements. Your scanner profiles and earlier Tapio measurements can be included, for example in a before and after comparison.
Do we need to use the Tapio Analysis software ourselves?
No. We do the measurement and the analysis and deliver the report. If you want to look at the data yourself, the Tapio Analysis software is free and open source, and its loaders can be extended to read QCS or other profile data.
Have a variation you cannot explain?
Describe the problem first and we help you scope the analysis, with the price and the sample instructions confirmed before you ship anything. You can also email info@tapiotechnologies.com. We normally reply within one working day.