

PapEye Dirt Count · cleanliness of pulp, paper and board
Count dirt specks in pulp, paper and board from scanned images
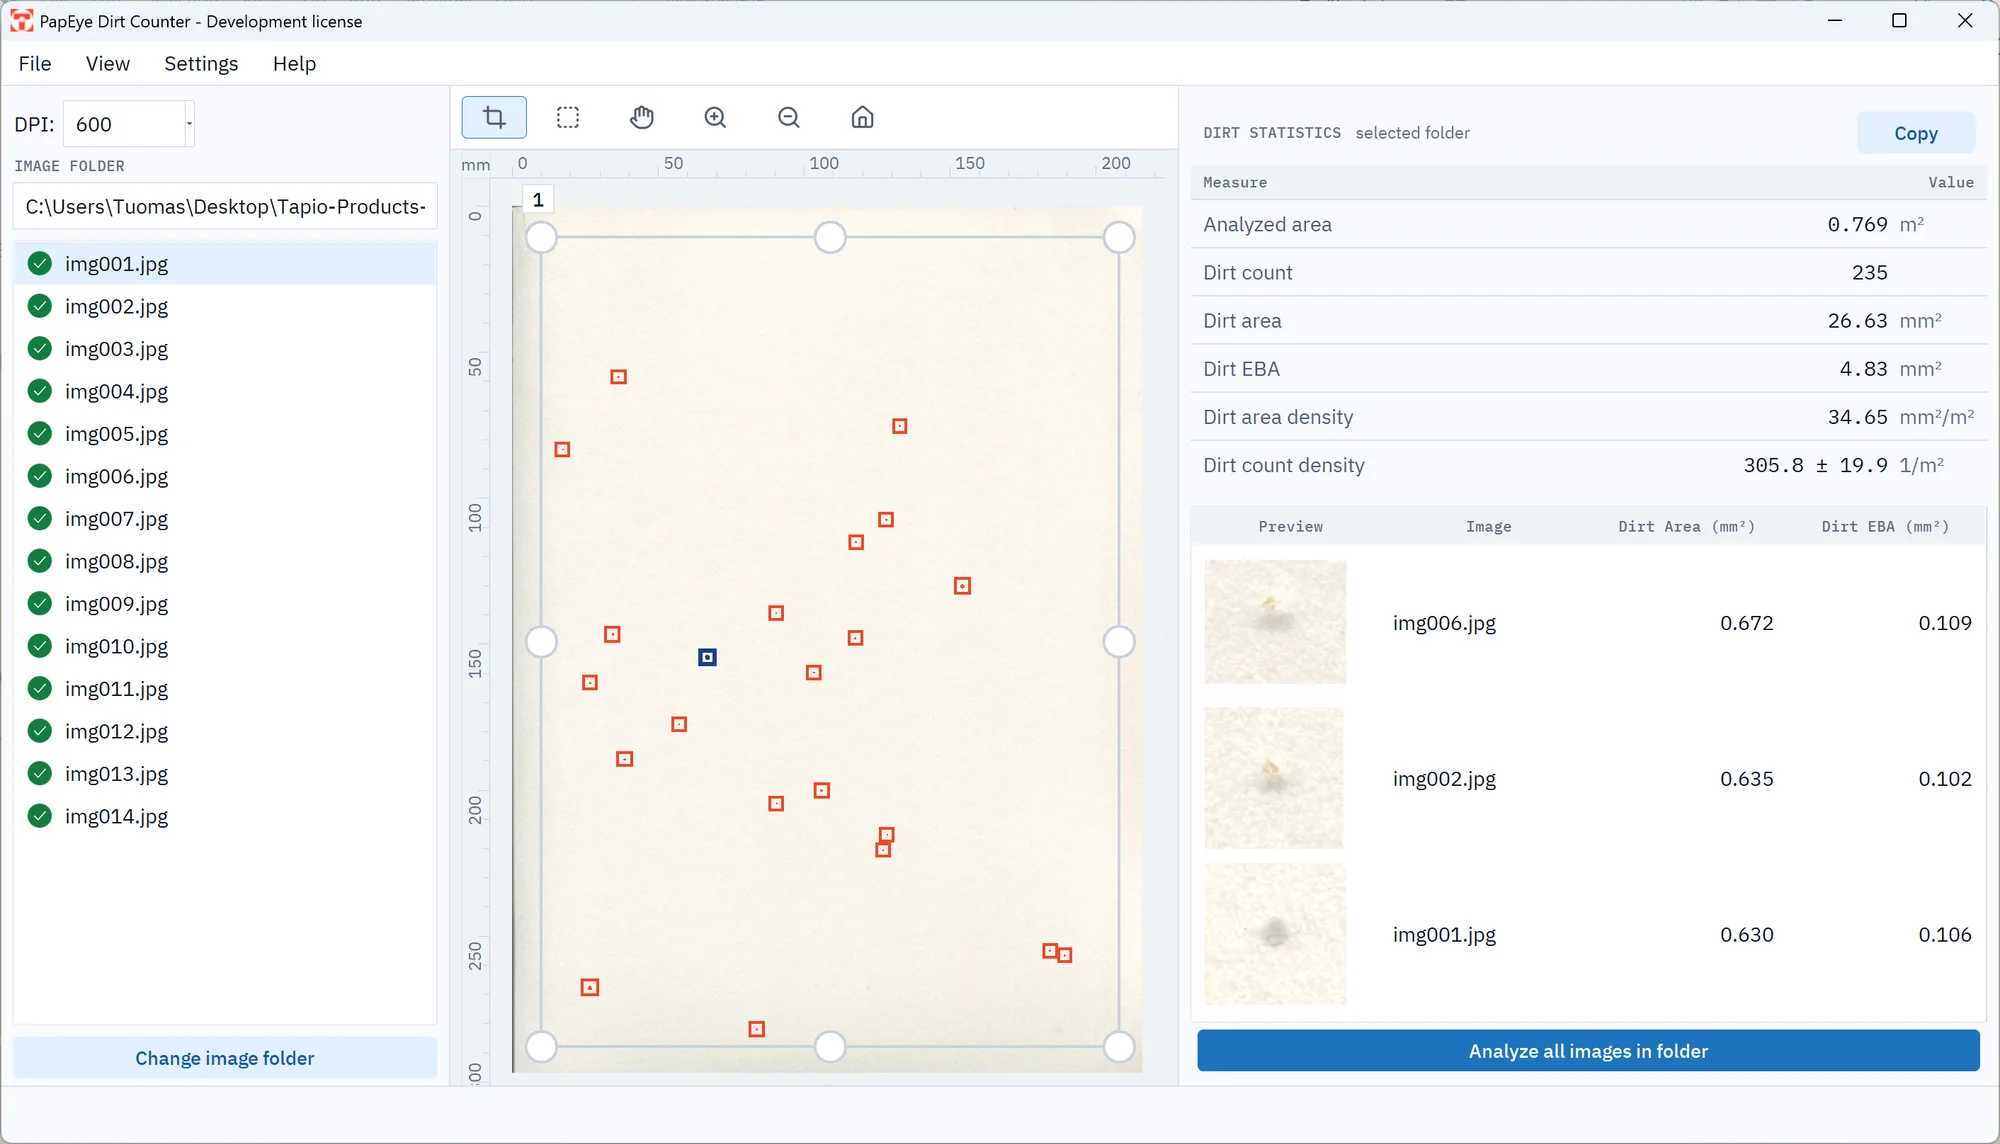
For pulp, paper and board quality control; no printed sample needed. PapEye Dirt Count finds the dirt specks in scanned samples, measures the area and visual impact of each one, and combines a whole folder of scans into one result, with a close-up of every speck so you can check what was counted.
One of three PapEye applications for scanned samples, and the one that is not about print. Measuring the quality of prints instead? See PapEye Print Uniformity and PapEye Line Quality.
What it reports
PapEye Dirt Count finds the dirt specks in a scanned sample. Every speck that stands out from the background is outlined, measured and listed, and the inspector checks the list instead of counting over a light table.
| Result | What it is | Reported as |
|---|---|---|
| Dirt count | The number of accepted specks in the analyzed area | Total count and specks per m², with its counting uncertainty |
| Dirt area | The measured area of each speck | mm² per speck, total mm² and mm²/m² |
| Equivalent Black Area (EBA) | The visual impact of a speck, from its size and its contrast against the background | EBA per speck and in total |
| Size distribution | How the specks are distributed by size | Histogram and the full result list |
| Close-ups | A thumbnail and the measured outline of every speck | Reviewed list; any detection can be excluded |
EBA tells a dark speck from a pale one of the same size. A sample with many small gray specks and a sample with a few black ones can have the same dirt count and very different EBA.
How the analysis works
- 01
Scan
Scan the samples at 600 to 1200 DPI. When the dirt level is low, scan several sheets to reach a representative area.
- 02
Analyze the folder
Select the folder and the area to measure. PapEye analyzes one image or all of them as one sample, and counts specks in overlapping regions only once.
- 03
Review and export
Go through the close-ups, exclude anything that is not dirt, such as a fiber, a fold or dust on the scanner glass, and export the results and statistics to CSV.
How much area to scan
The number of specks counted sets the counting uncertainty, so the cleaner the sample, the more area it takes. Under a Poisson counting model, counting N specks gives a standard deviation of about √N, so about a hundred specks correspond to roughly 10 % relative counting standard deviation. The total uncertainty of a result also depends on how the samples were taken and on detection: thresholds, false detections and missed specks, and the scanner.
Take a board sample with about 20 specks per A4 sheet. One sheet gives a counting standard deviation of about √20, roughly 22 %. Five sheets scanned into the same folder give about 100 specks and about 10 %, and PapEye reports them as one result with the count density per m². (The numbers here illustrate the arithmetic; they are not a measured case.)
Settings and requirements
| Setting | |
|---|---|
| Speck size | 0.02 to 3 mm² by default; the lower limit can be set down to 0.002 mm². Larger specks are not reported |
| Contrast | An optional minimum contrast against the background |
| Shape | An option to accept only compact, speck-like shapes and reject fibers and streaks |
| Edge level | Where the outline of a speck is drawn |
| Requirement | |
|---|---|
| Operating system | Windows, Linux |
| Installation | None: unzip the download and run the program |
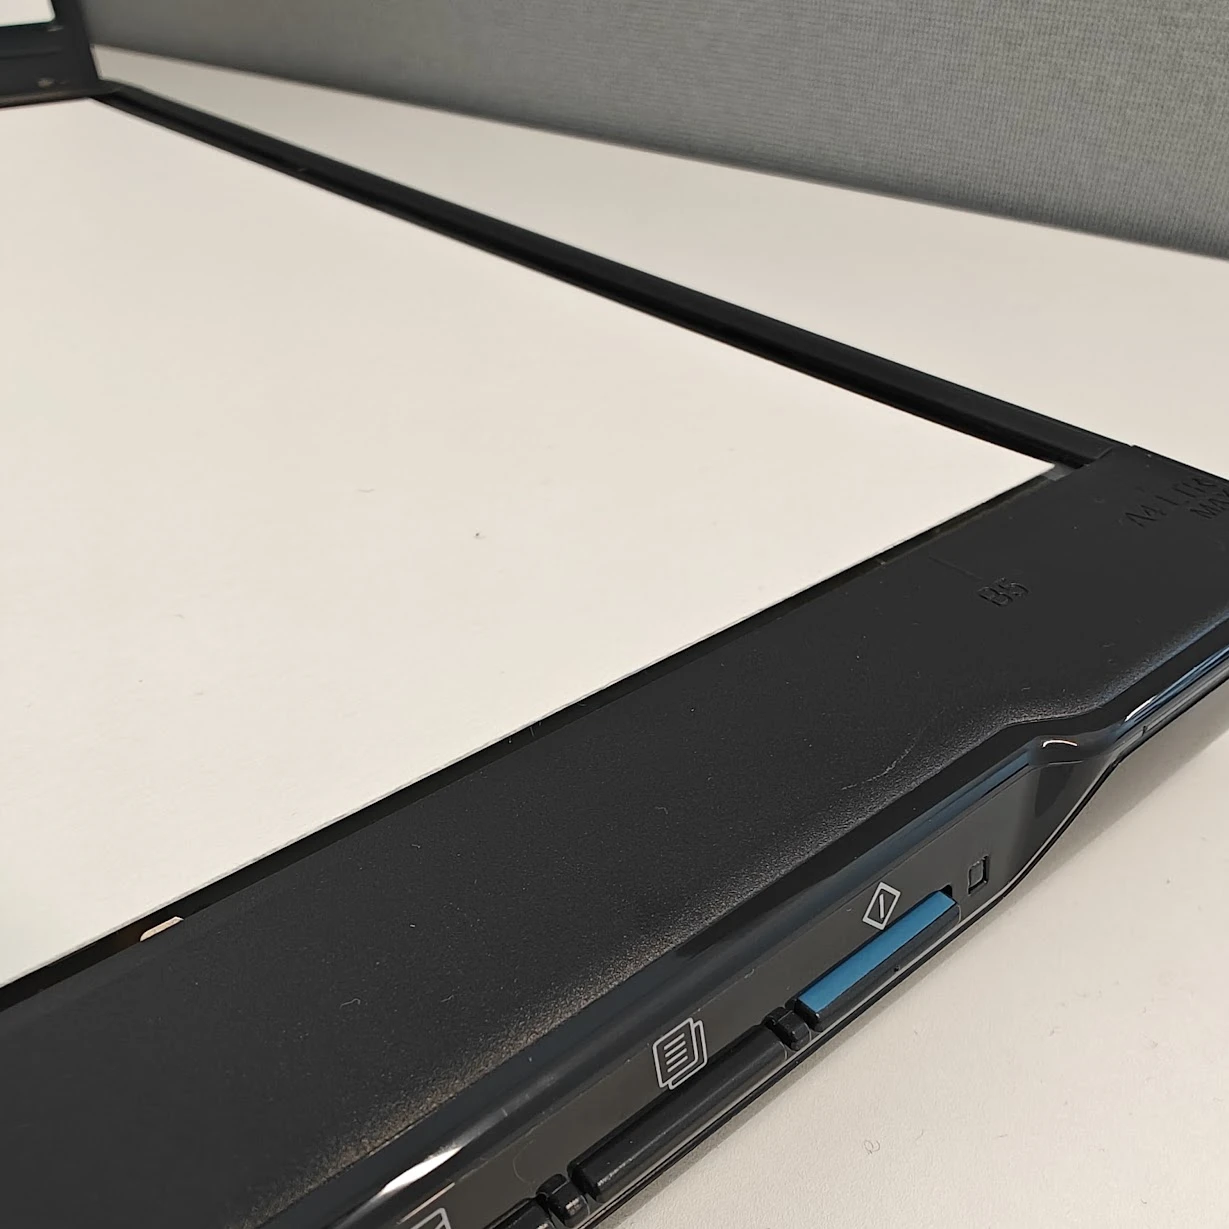
| Scanner | A standard flatbed scanner, 600 to 1200 DPI; ask us for a list of recommended models |
| Input | Single images or complete folders (PNG, JPEG, GIF, BMP, PDF) |
| Results | Dirt count, area, EBA, densities per m², size histogram and summary statistics |
| Export | CSV (semicolon-separated, opens in Excel) and copy to clipboard |
| Method | Developed by Tapio. The EBA follows the visual-impact idea of TAPPI T 563 and ISO 5350-4, but the software does not implement a TAPPI or ISO dirt count standard |
| License | A permanent license for one PC |
Each PapEye application has its own license, so a Print Uniformity or Line Quality license does not unlock Dirt Count. Ask us for a demonstration or a quote.
FAQ
Do the samples need to be printed?
No. Dirt Count measures specks against the background of the pulp, paper or board sample itself.
What is Equivalent Black Area?
A measure of how visible a speck is. It takes both the size and the darkness of the speck into account, so a pale speck has a smaller EBA than a black speck of the same size.
How do I classify the specks?
Go through the result list with its close-ups and include or exclude specks by their appearance, area or other properties. The totals and statistics update to match.
Does it find things that are not dirt?
Detection is based on contrast against the sample, so dust, fibers or creases can be picked up, as with any dirt counting method. The shape setting rejects most fibers and streaks, and the close-ups make the rest quick to exclude.
What scan resolution do I need?
600 to 1200 DPI, depending on the smallest specks you need to count. At lower resolutions the smallest detectable speck gets larger, and small specks are undercounted.
Does it follow a TAPPI or ISO method?
No. The method was developed by Tapio for quality control, trend monitoring and comparisons made with the same sampling and scanning routine. If you need a result to a specific standard, compare the two methods on your own samples first.
Does the scanner affect the dirt count?
Yes. The scanner's resolution, sharpness, tonal response and settings affect which specks are detected, so keep the scanner and its settings fixed for results you want to compare. Dirt Count has the same scanner calibration features as the other PapEye applications, and calibration can be done as required.
Cases and examples
Request a demo or quote
Tell us which grades you inspect and how you sample them today.
You can also email info@tapiotechnologies.com.