

Tapio RQP Live · handheld roll hardness profiler
Roll hardness profiles for paper, board, film and foil rolls
For production, winding, converting and quality teams. Measure across the roll, see the hardness variation immediately and compare it with your own acceptance limits. The profiles sync to the free Tapio RollView PC software.
What RQP Live is used for
Soft edges, loose streaks and uneven winding tension turn into wrinkles, web breaks and complaints when a roll is unwound, printed or converted, and none of them shows on the surface. Knocking with a stick, or taking readings at a few points, samples only part of the width. RQP Live records hardness continuously across the roll and calculates its statistics. Rolls can be judged and compared on numbers.
Paper and board mills
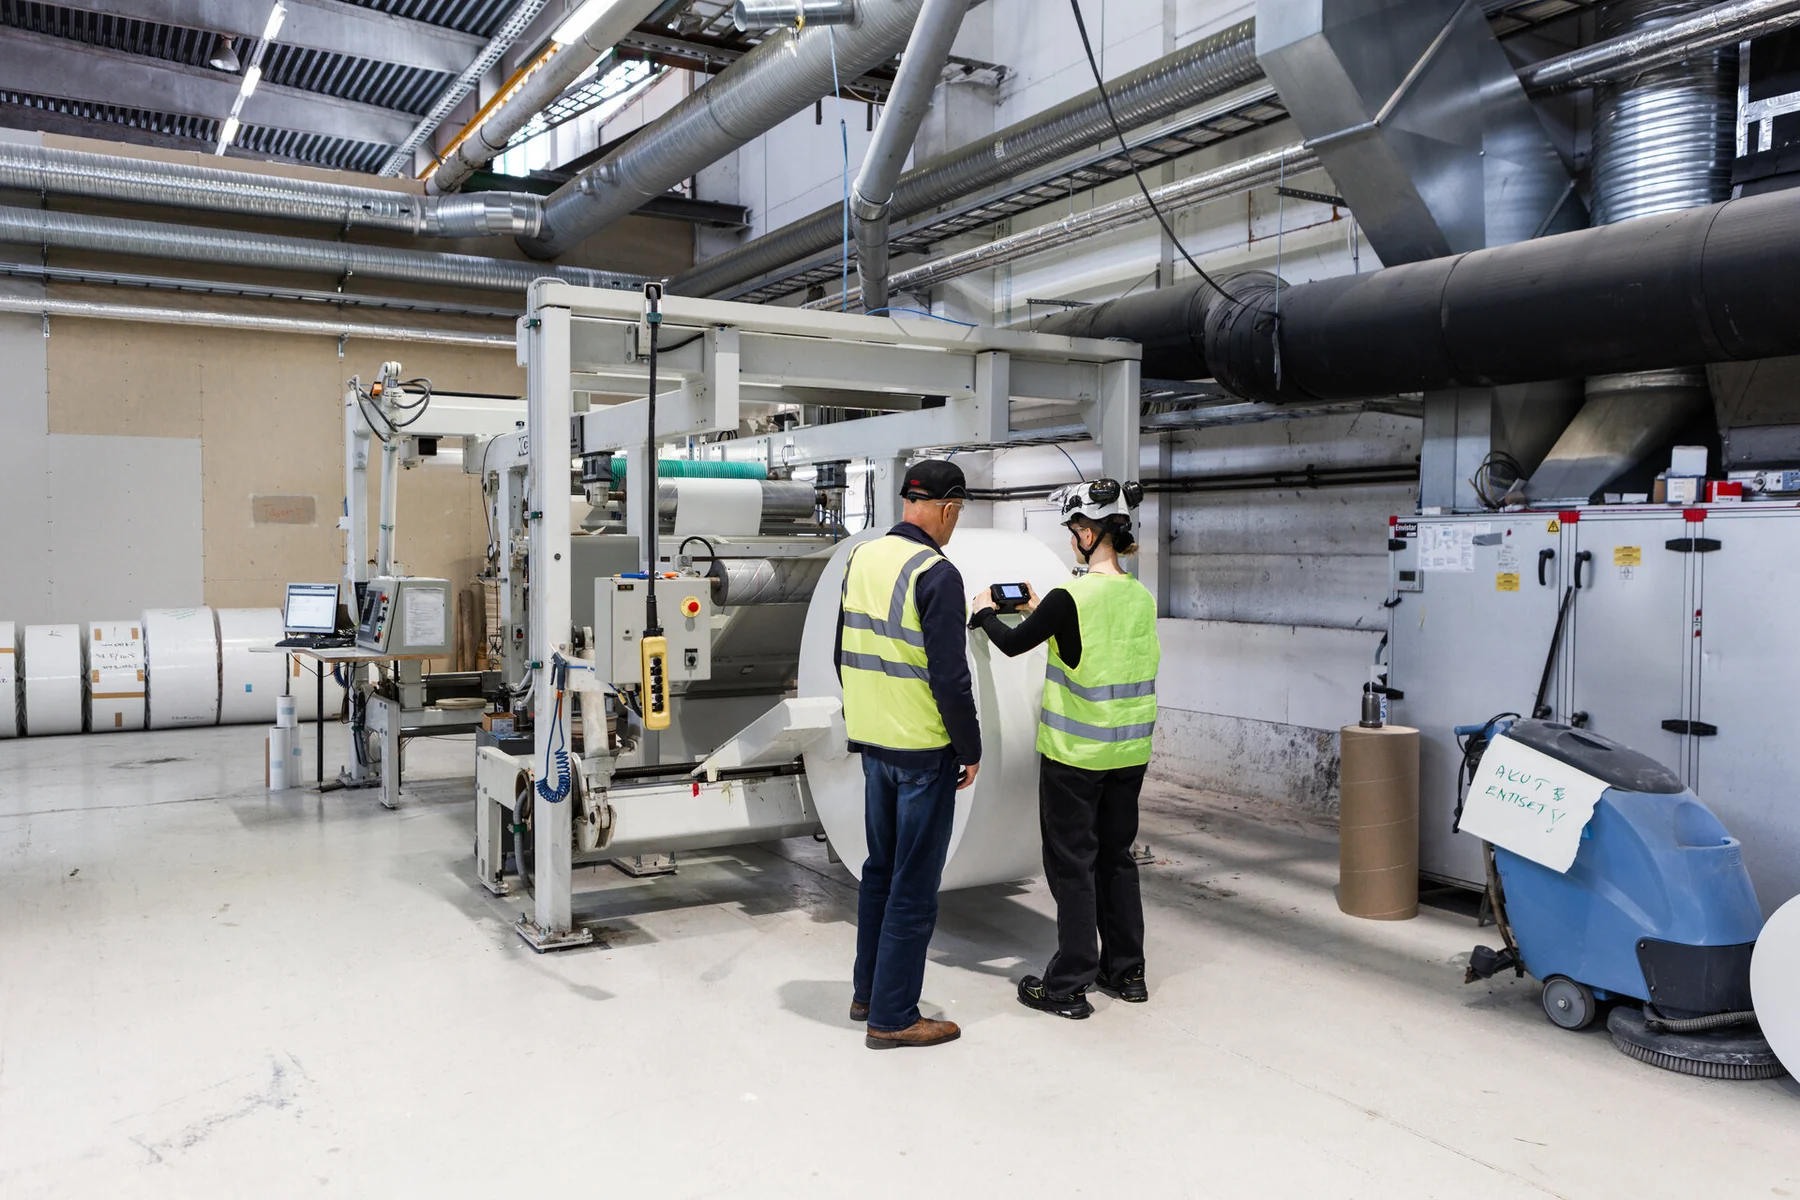
Production and quality teams check customer rolls and parent reels at the winder or rewinder, document roll acceptance and compare rolls, shifts and winder positions.
Film and foil producers
Film, foil and laminate producers look for tension and gauge-related variation that a roll's surface does not show, before the roll goes to the customer.
Converters and printers
Converters check incoming rolls, and investigate winding and unwinding problems with profiles they can share with their supplier.
What it finds
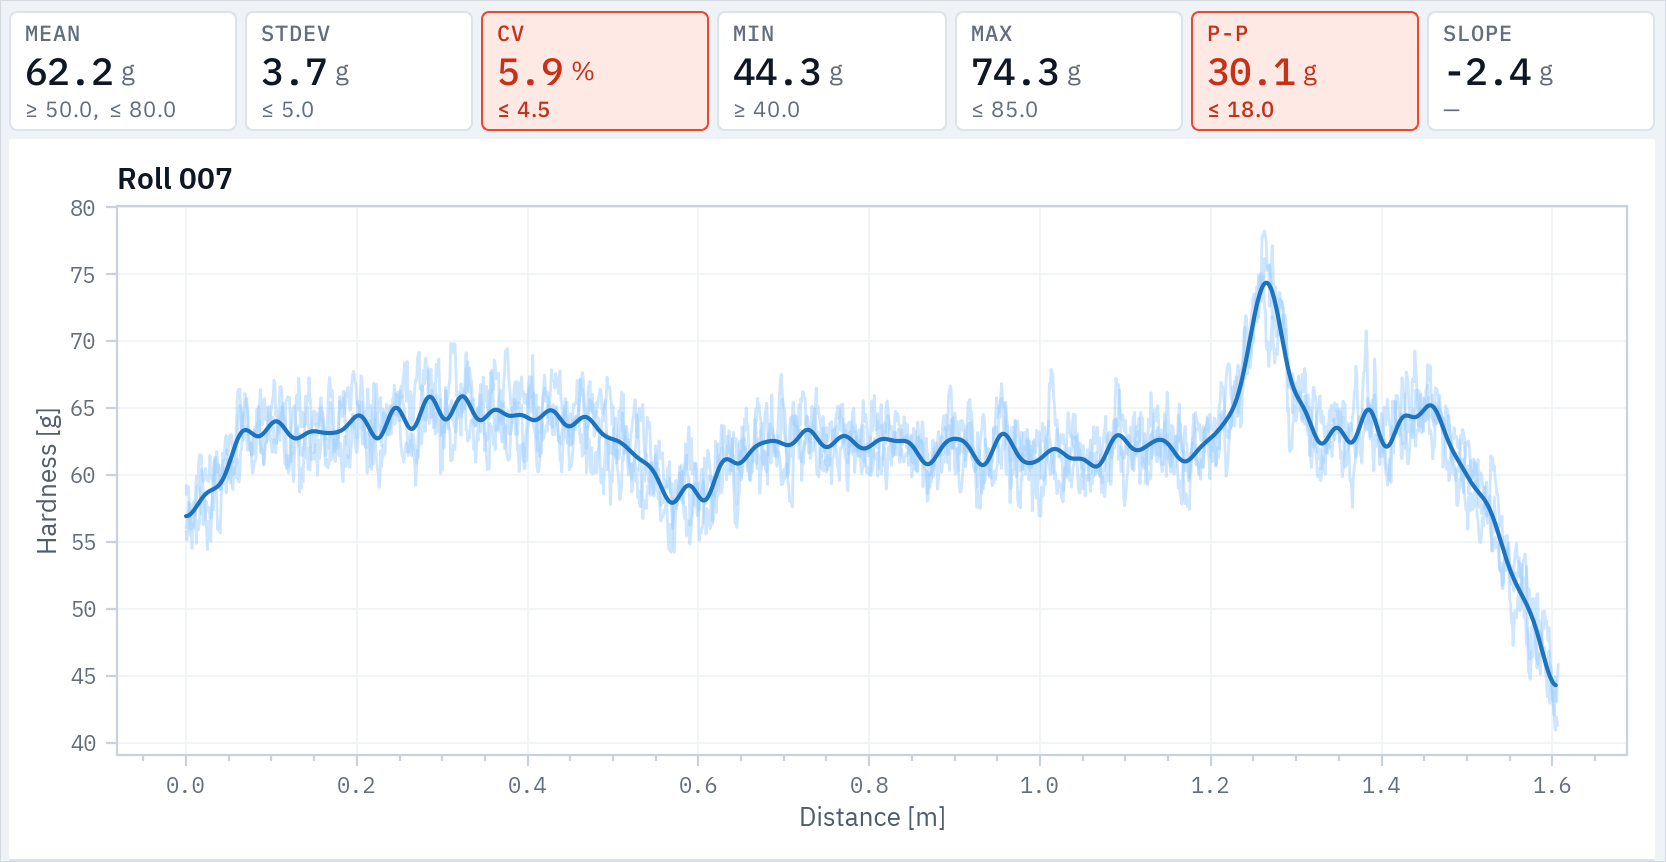
Roll hardness reflects how tightly the material is wound, and with it the tension, thickness and density variation built into the roll. In general, the roll hardness profile is a great quality indicator of the roll. A uniform roll gives a flat profile.
Soft and loose edges
Edges and edge rolls are often softer than the middle. The profile shows where the hardness drops below your limit and how wide that zone is.
Streaks and narrow soft zones
A narrow soft or hard streak can fall between spot checks taken at fixed points. RQP Live records hardness continuously with position as it crosses the roll, so the streak appears in the profile.
Tension and thickness variation
Hardness is influenced by caliper, gauge and winding tension, so their variation across the roll often shows in the profile. It is a lead to investigate, not a thickness or tension measurement.
Bagginess and wrinkles
Baggy areas in film and paper can show as deviations in the hardness profile before the roll is unwound.
Tilted profiles
A slope across the width can point to thickness variation or to alignment problems in winding.
Rolls wound too loosely or too tightly
Mean hardness against the limits for your grade shows whether the whole roll is out of range.
Rolls and materials
RQP Live is used on parent reels and machine rolls, customer rolls and roll ends. Because it measures the finished roll, it checks quality after production, winding, transport and storage alike. Suitability, the risk of marking a sensitive surface and useful alert limits depend on the material and the roll, so check them on your own rolls first: a demo or a trial is the place to do that.
Paper and board
- Consumer board, sack paper, kraftliner and fluting
- LWC and SC, where hardness profiles are used to tune slitting
- Newsprint, where press runnability needs uniform rolls and tightness near the core matters
- Release paper
- Comparing CD profiles with the QCS, and following calender loading and the caliper profile with hardness feedback
Plastic film
- Flexible packaging: BOPP, BOPET, BOPA (nylon), PE, PP, PVC and PET
- Blown and cast film; technical and special films
- Thin, medical and industrial films, where tension and thickness variation matter
- In film, hardness has often followed the gauge profile closely
Metal foil
- Aluminum foil for food and pharmaceutical packaging
- Copper foil for electronics and printed circuit boards
- Laminates of foil with polymers or paper
Battery materials
- Separator films and coated separators
- Cathode and anode foils
How it works
- 01
Identify the roll
Scan the roll's barcode with the built-in reader, type its ID on the screen, or pick an existing folder. The device keeps the roll's profiles together.
- 02
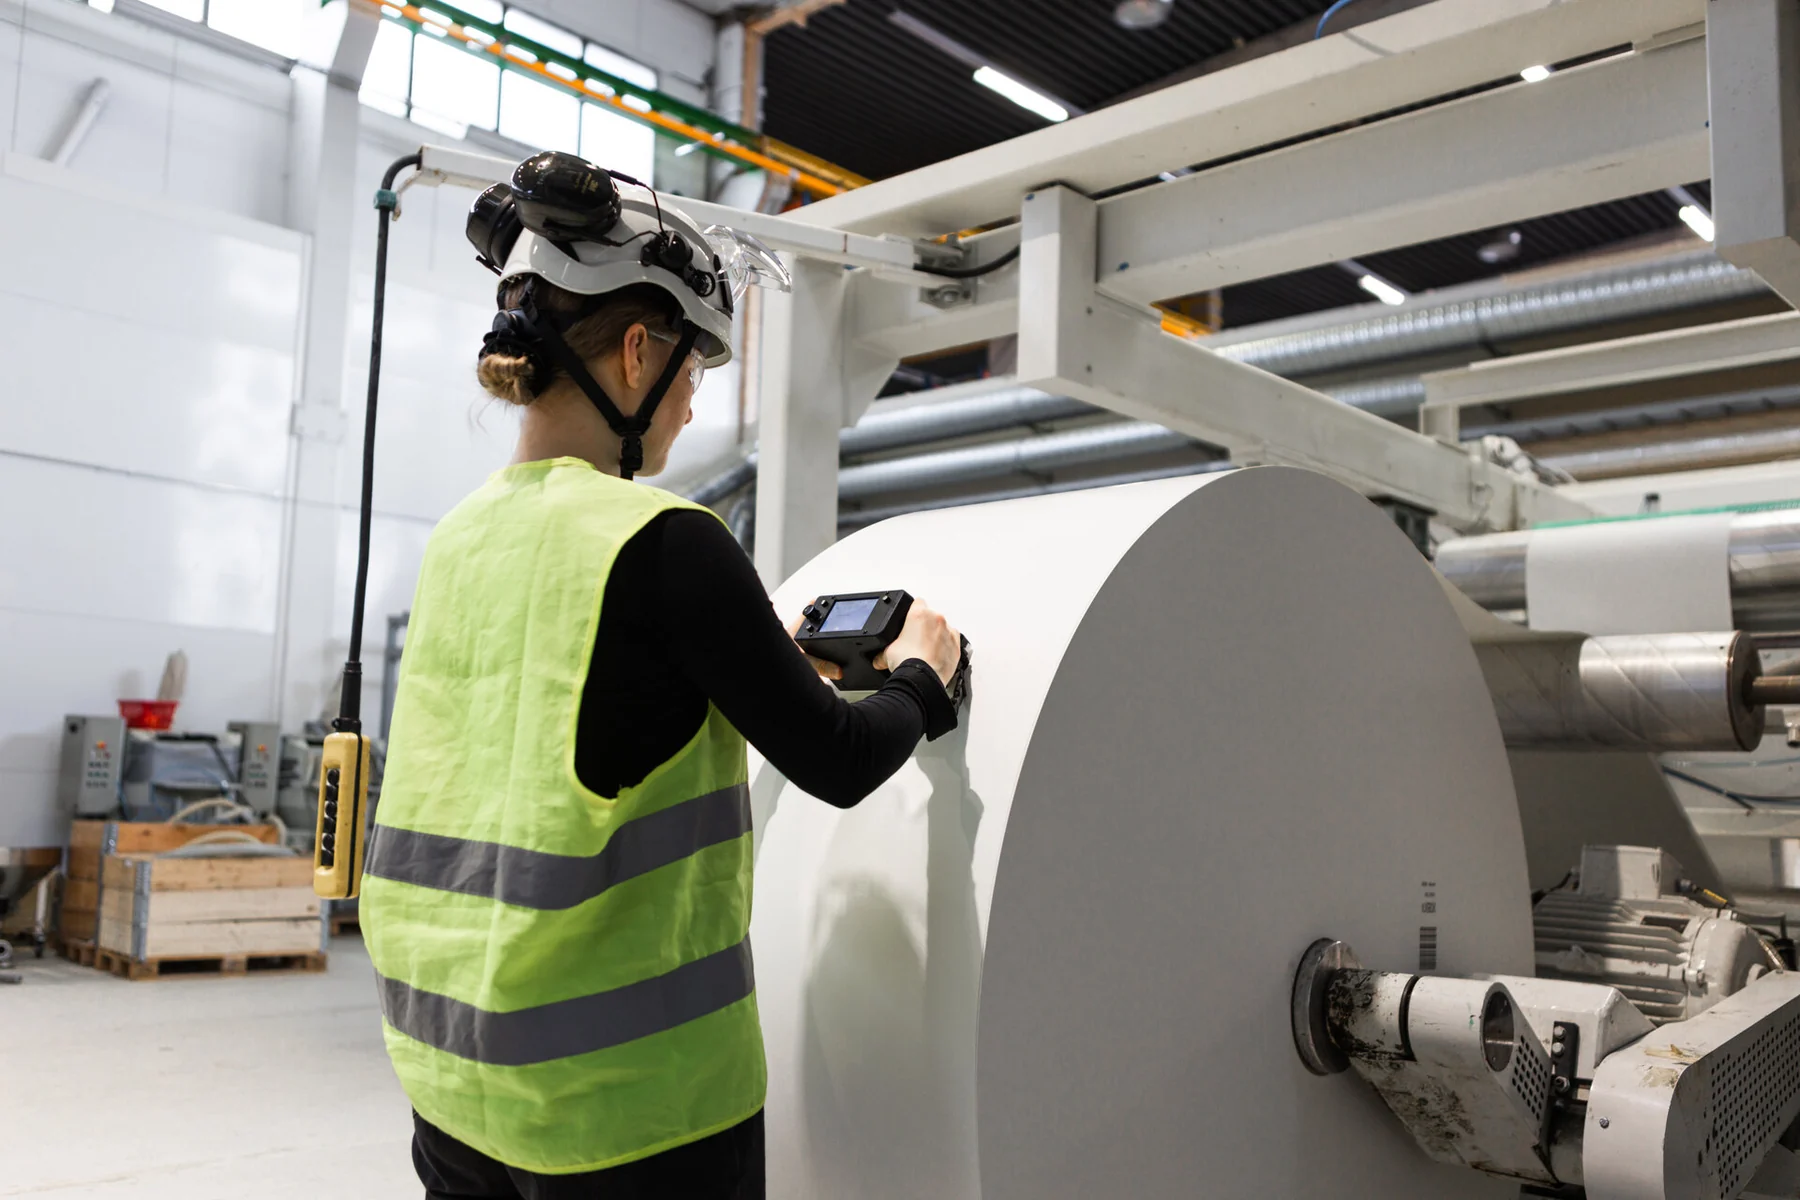
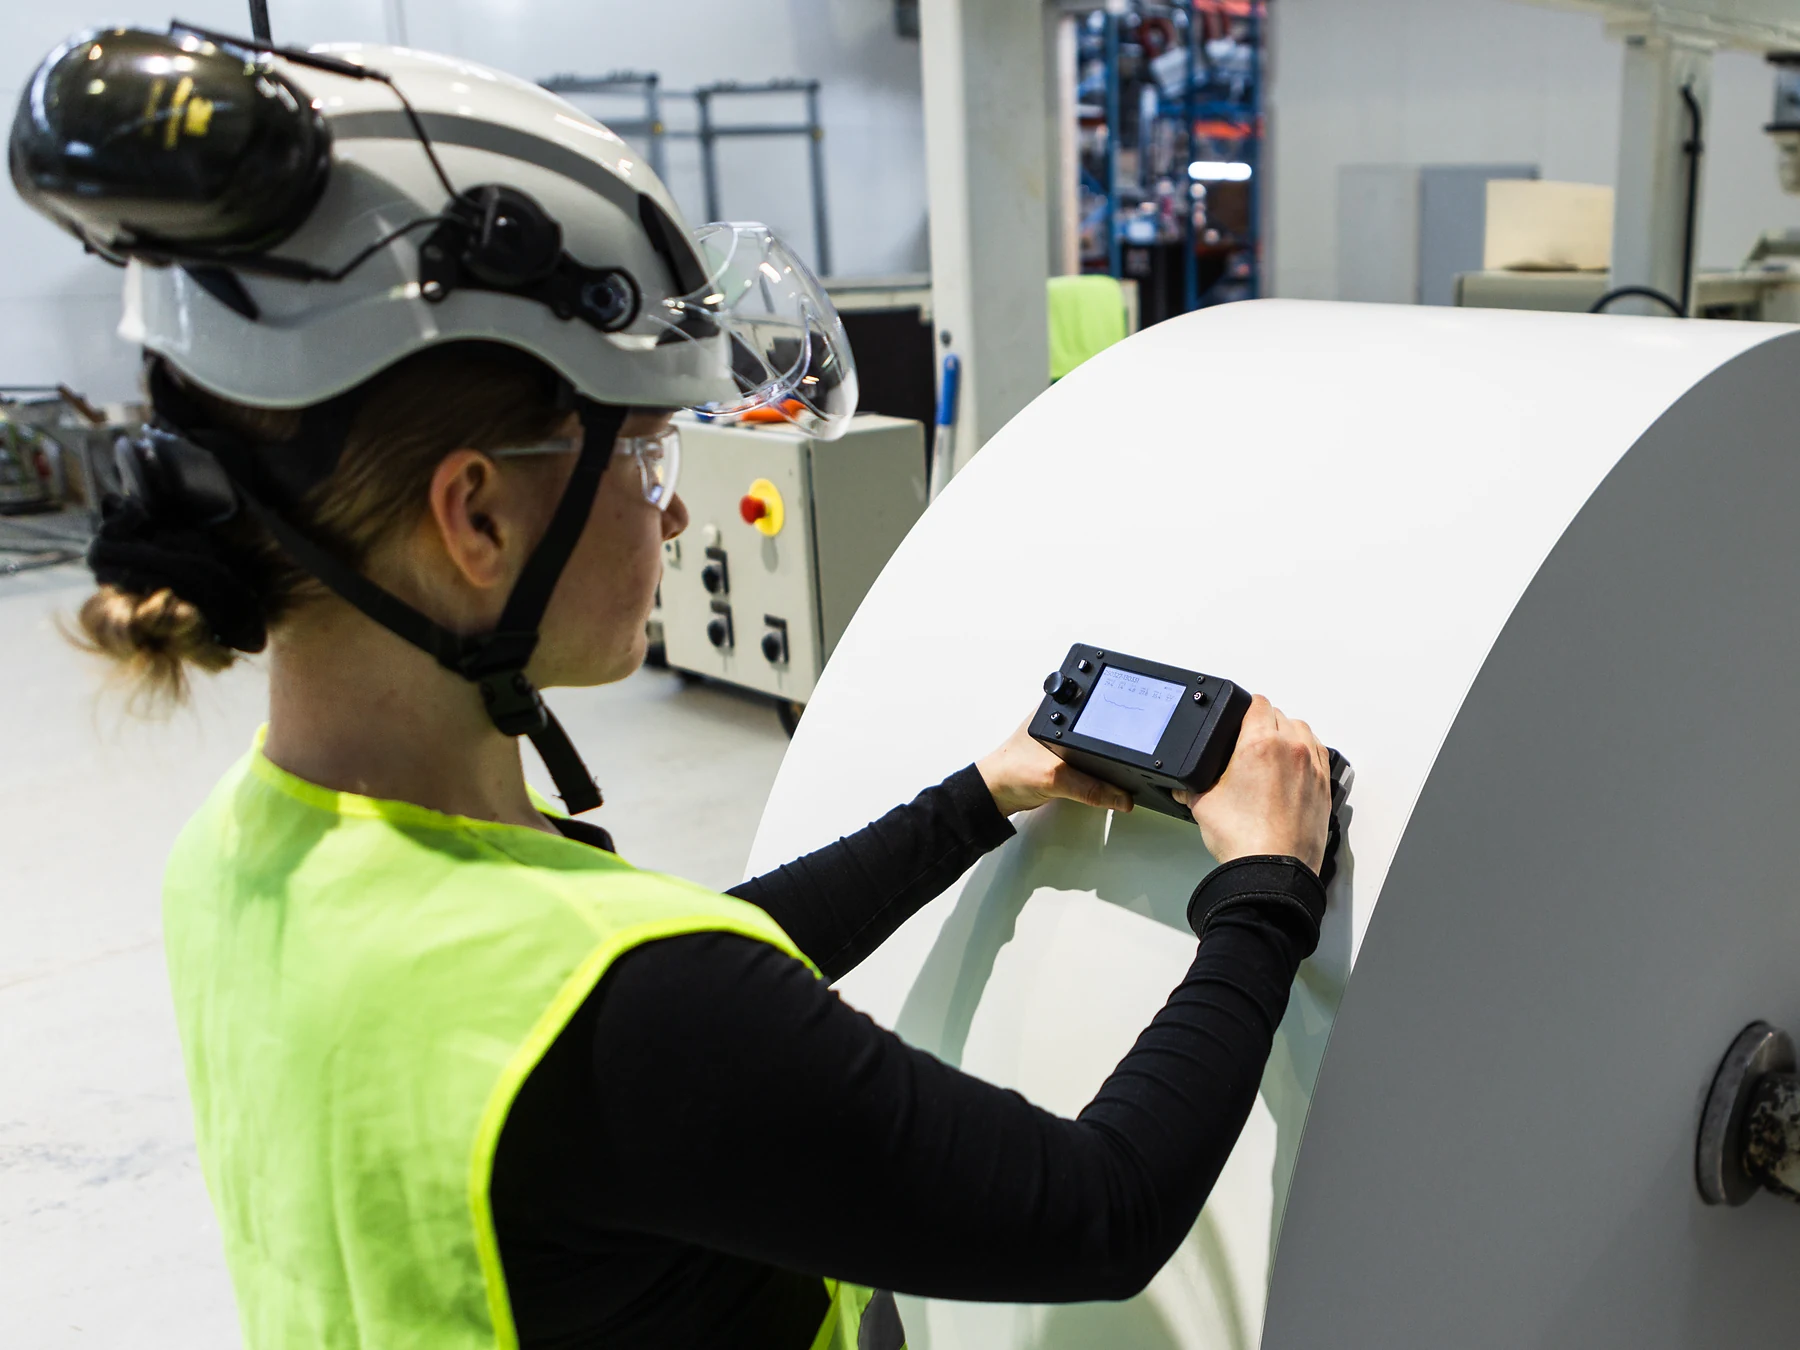
Push the profiler across the roll
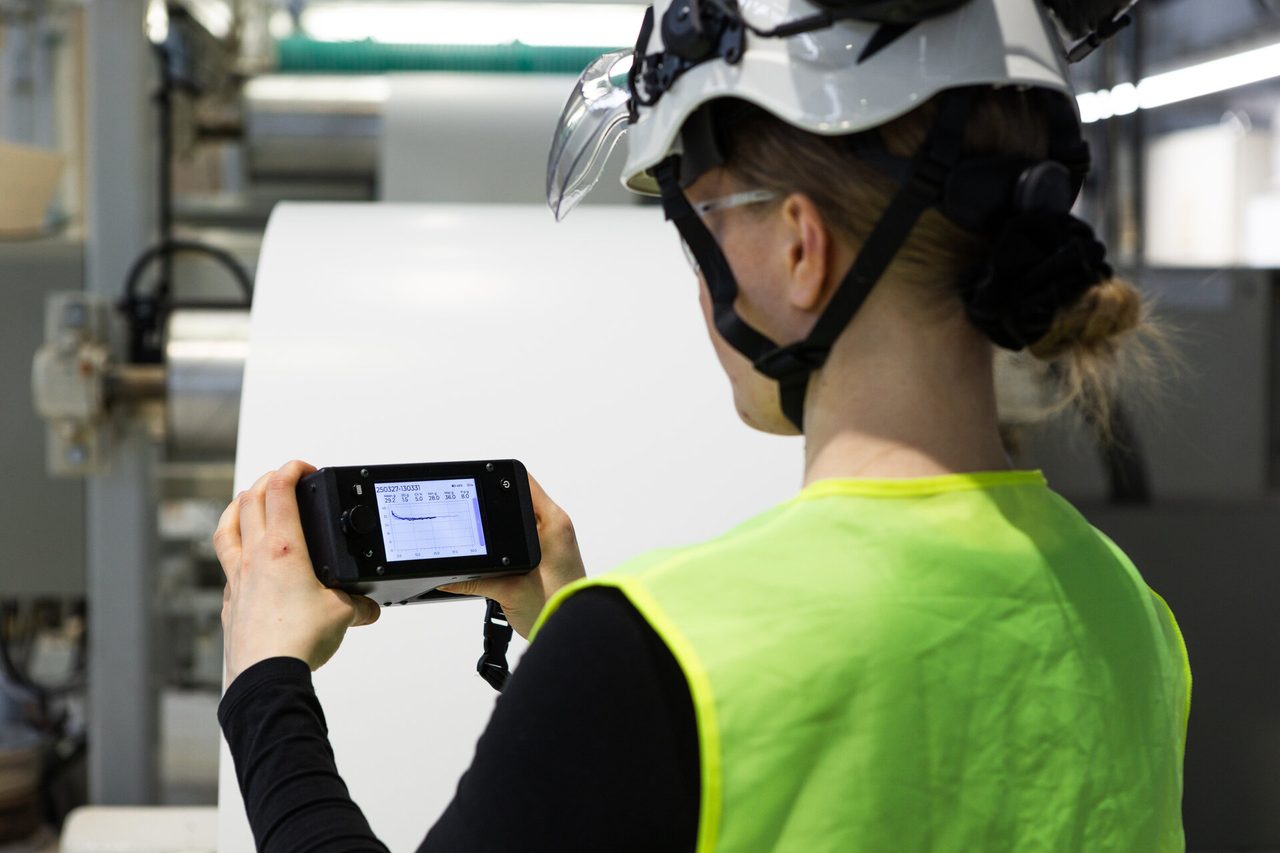
Align the hammer mark on the roll edge and push the device down to start knocking. Hold it still for a moment, then push it across the roll at the recommended speed. The hammer strikes the roll repeatedly while the wheel measures the position, and a speed bar on the display turns red if you go too fast. The profile is shown on the display in real time during the measurement.
- 03
Accept or reject at the roll
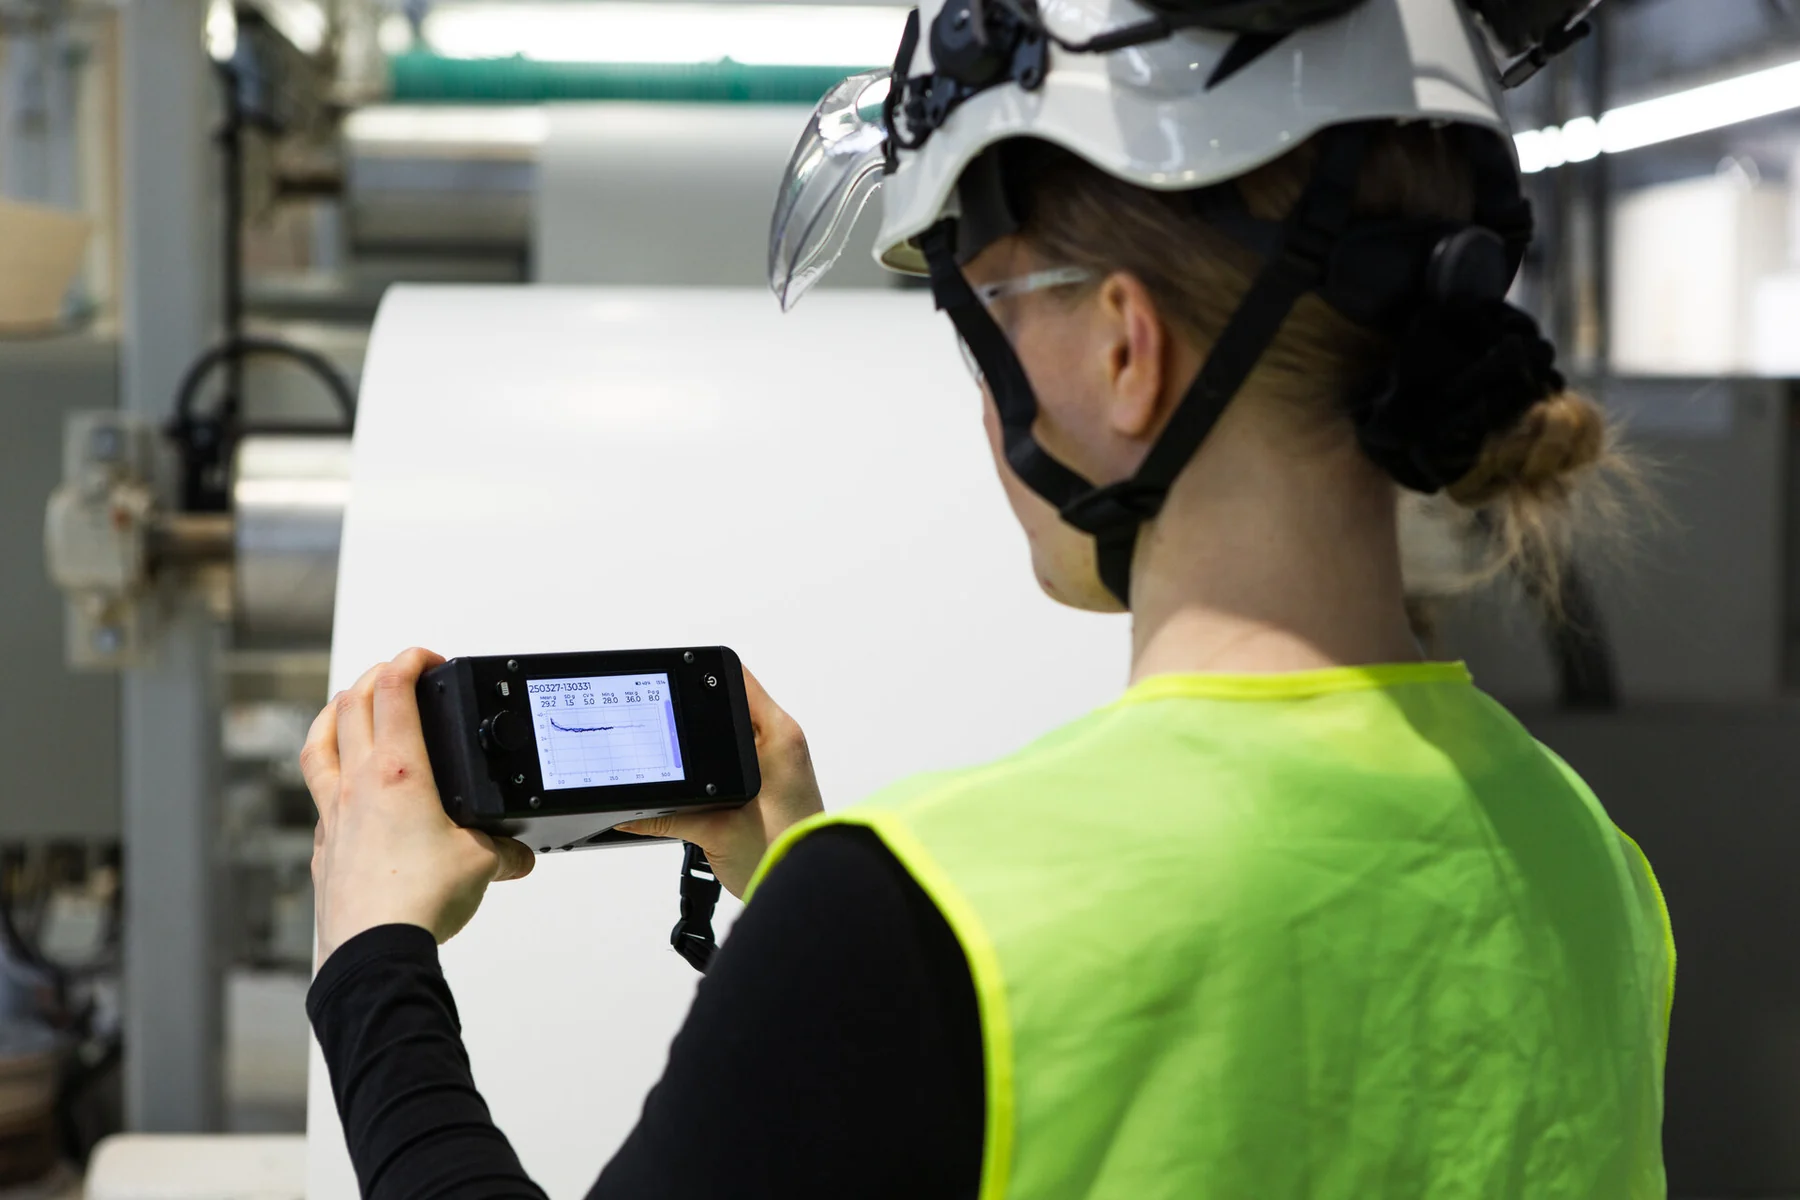
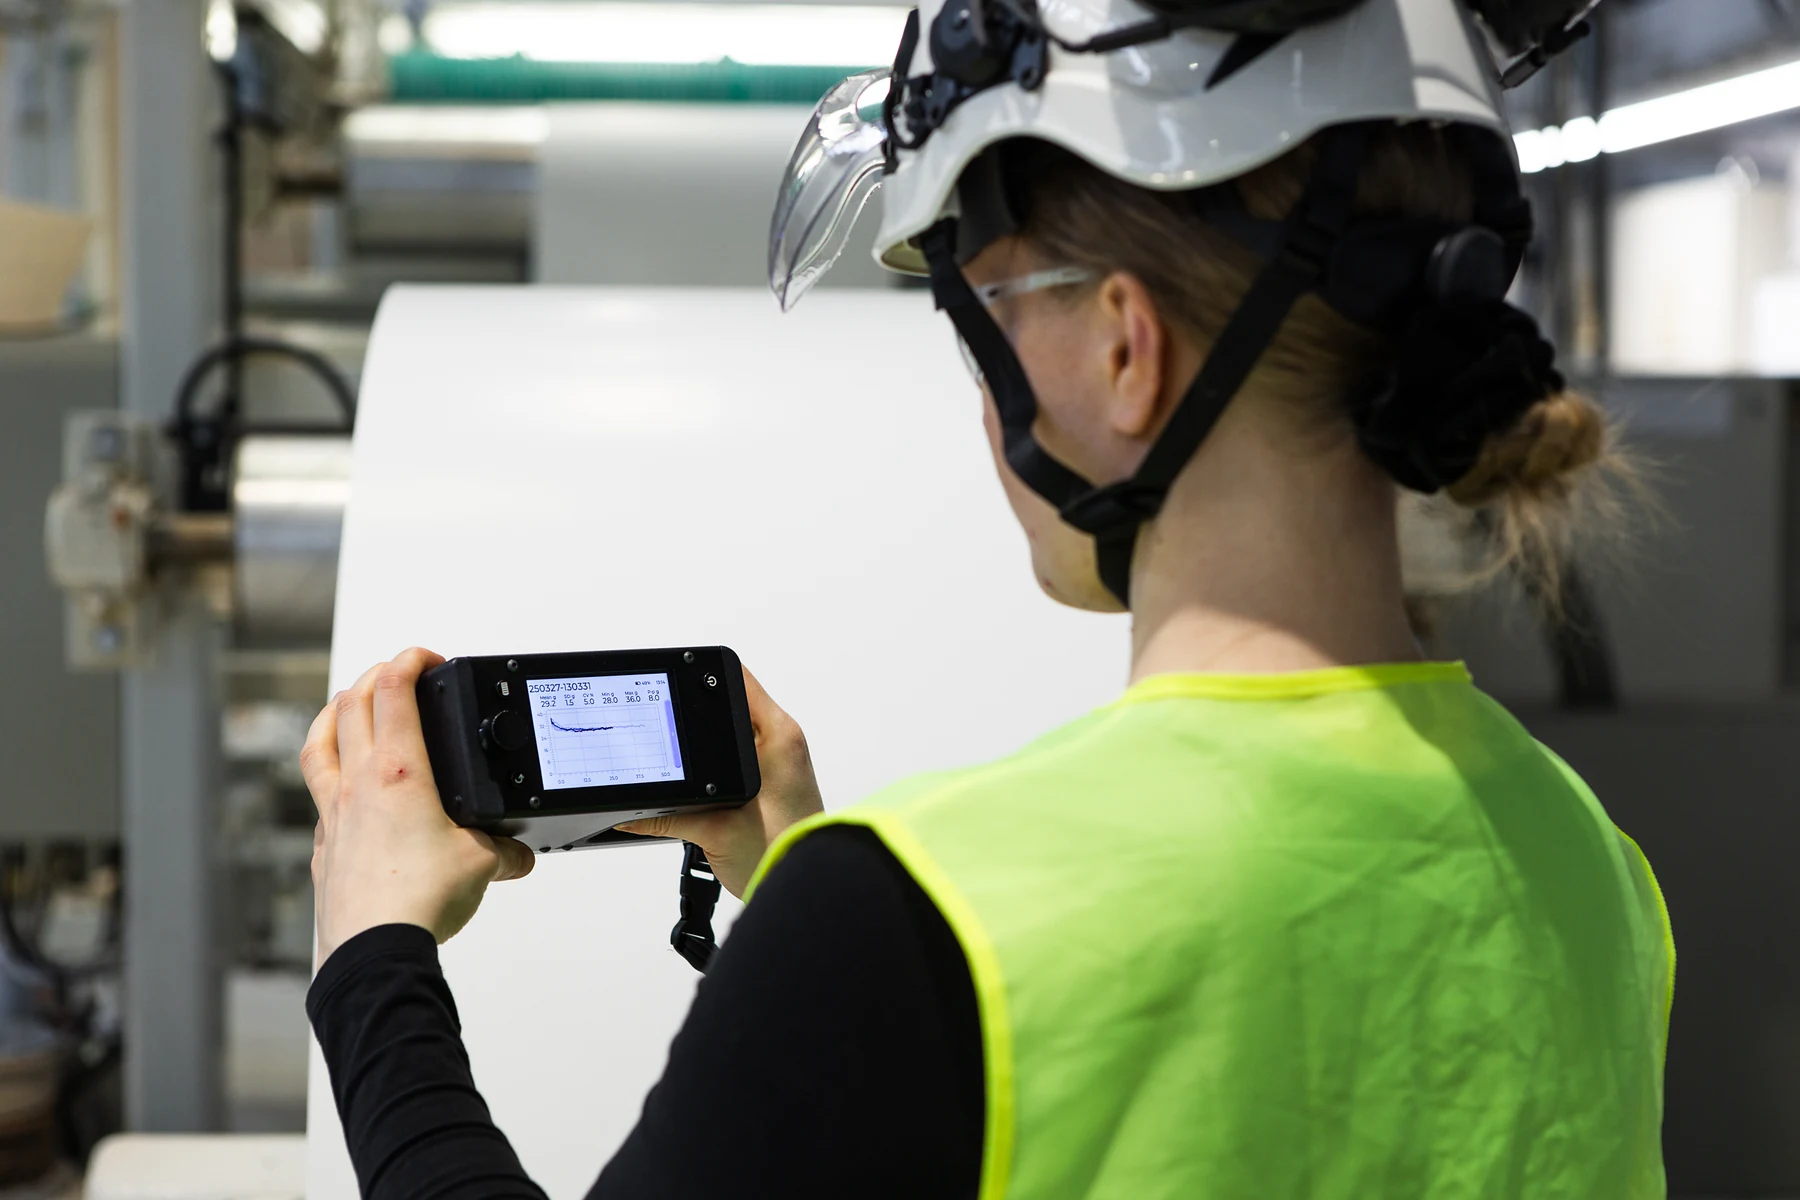
The display shows the profile with its mean, standard deviation, CV%, minimum, maximum and peak-to-peak. Values outside your alert limits turn red. Measure two or three passes and the device shows their mean profile, with the statistics calculated from it.
- 04
Sync to Tapio RollView
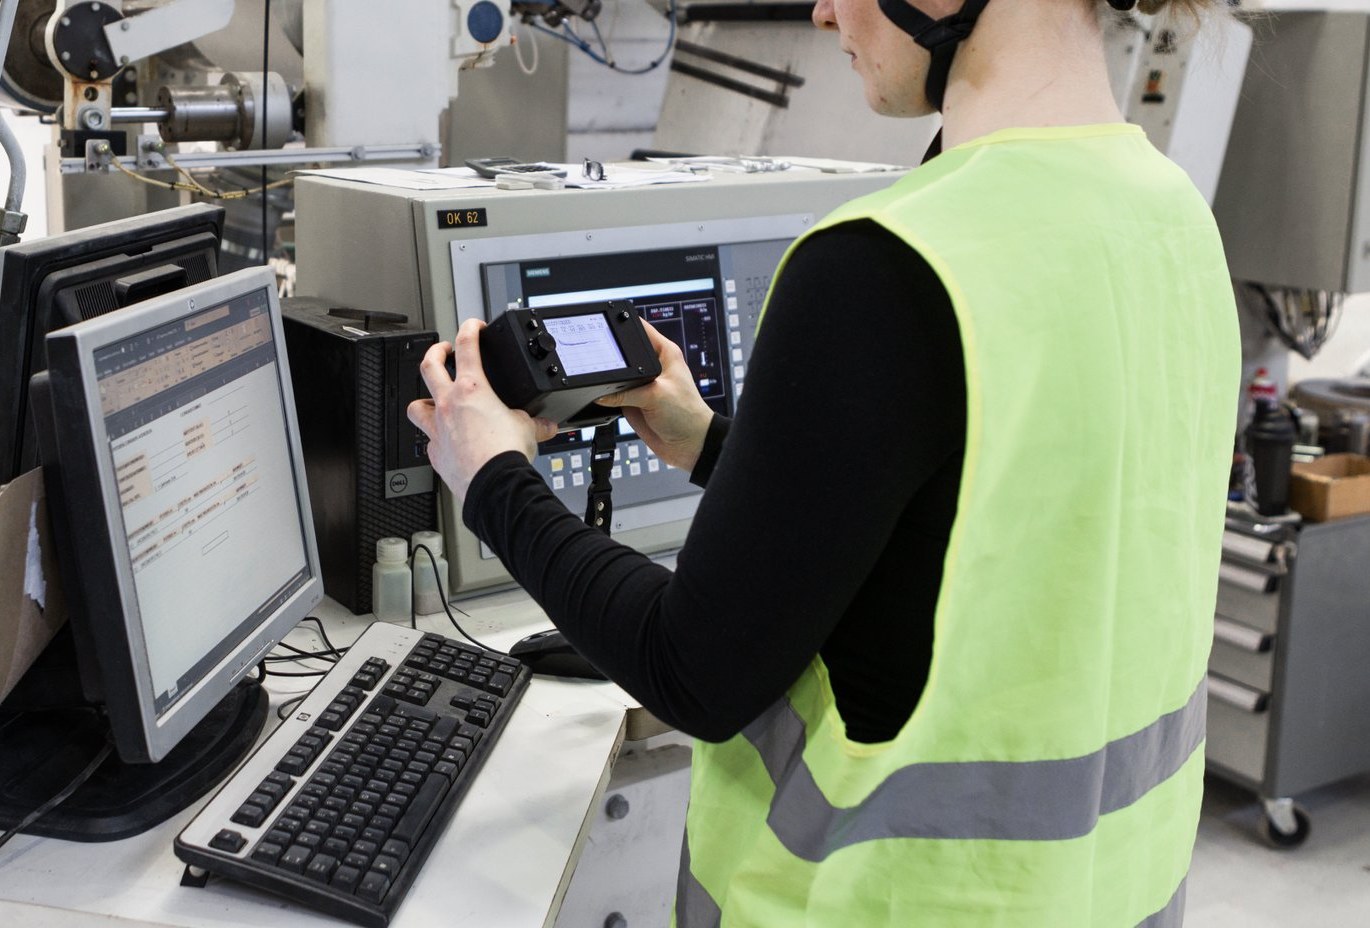
Transfer the folders to a PC over Bluetooth or a USB-C cable. The profiles sync to the free Tapio RollView PC software, which can be configured to export the data in any required format.
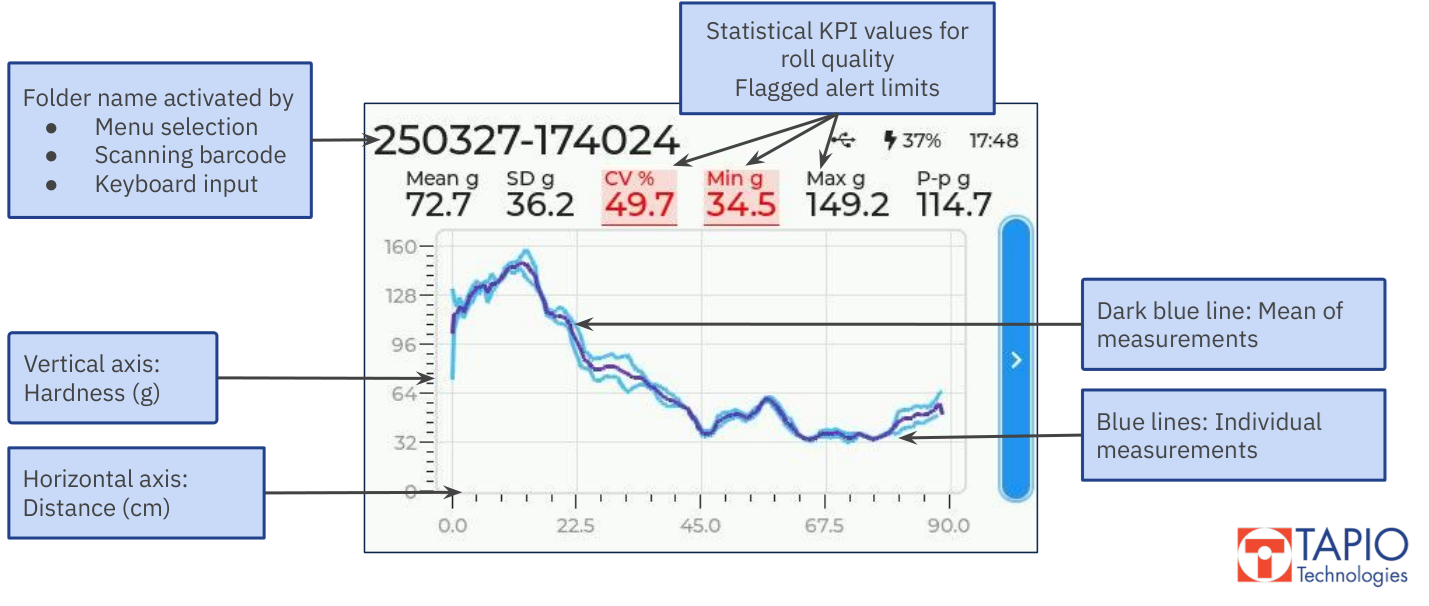
What the operator sees at the roll
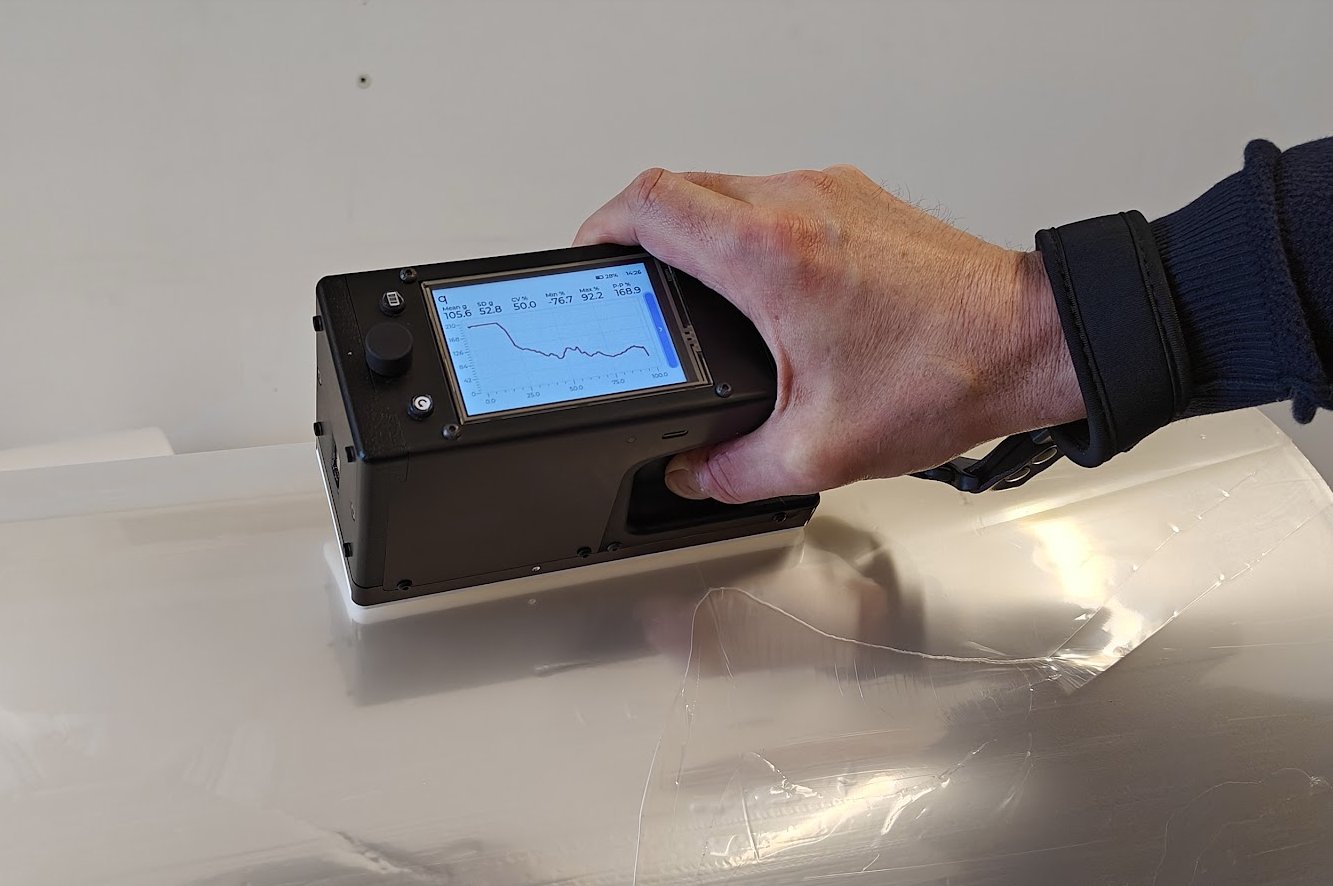
This plastic roll has a mean hardness of 72.7 g, but a CV of nearly 50 %, with values from 34.5 g to 149 g. The profile rises steadily from one end to the other; follow-up work pointed to thickness variation in the film.
CV% and the minimum are outside their alert limits, so both turn red on the display. You set the limits for your own product, on the device or in Tapio RollView. Limits are usually set from rolls known to have caused problems.
On paper and board the same limits work the same way. In the rewinder case above, mean hardness was practically identical across the whole set, and a CV% limit of 5 %, set from rolls the converter had rejected, was what separated the two edge rolls from the rest, at the rewinder and before shipment.
The device
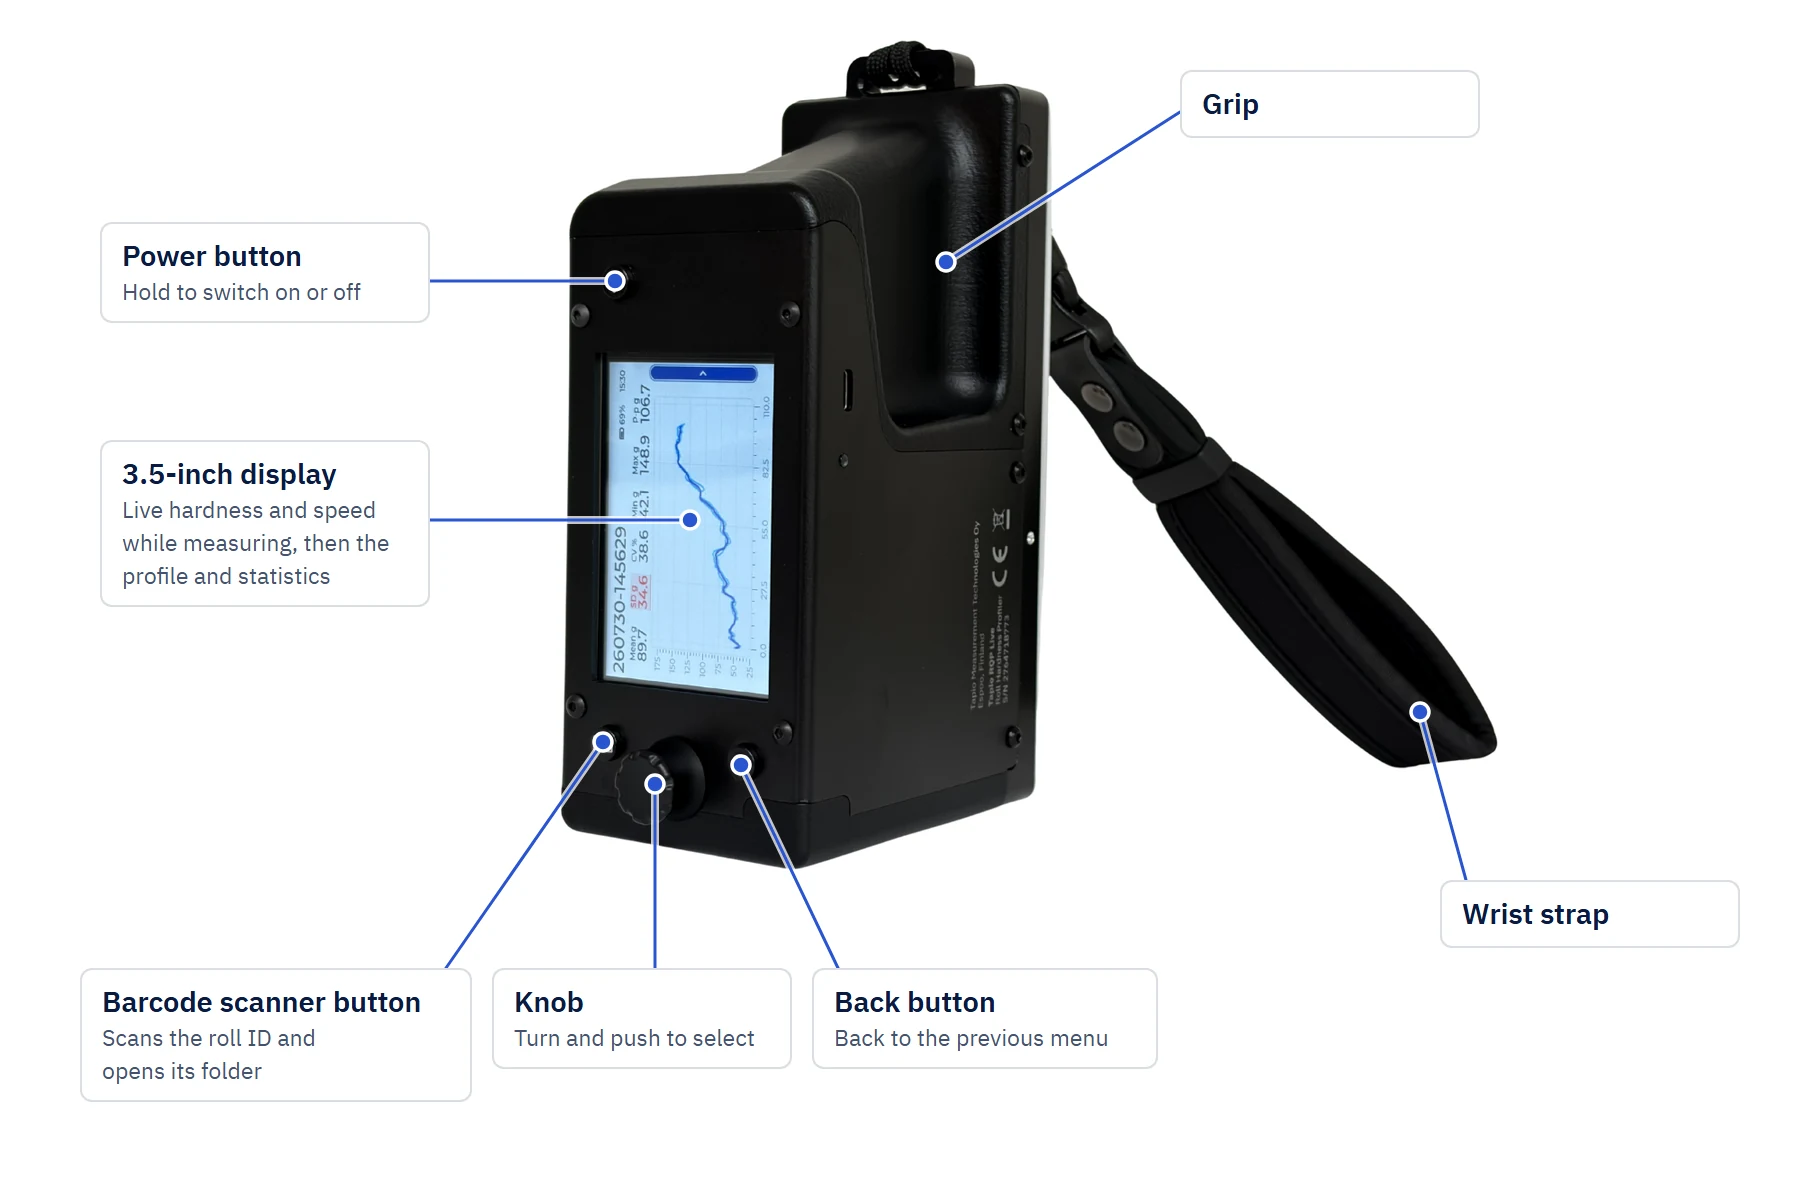
Built for the mill floor
- One-button measurement and a live profile on the 3.5″ display
- 1.25 kg, battery powered, charged over USB-C with a compatible Power Delivery charger
- Menus in English, German, Finnish, French, Spanish, Portuguese, Japanese and Chinese
- Alert limits and other settings loaded by scanning a QR code made with the RQP Live Configurator or RollView
- No network setup: the device talks only to the PC it is synced with
Specifications
| Specification | Tapio RQP Live |
|---|---|
| Measurement principle | Deceleration of an impact hammer, recorded together with the position along the roll |
| Hardness value | Peak deceleration in g (acceleration relative to gravity, not grams); a relative scale |
| Statistics on the device | Mean, standard deviation, CV%, minimum, maximum and peak-to-peak, each with alert limits |
| Roll sizes | 10 cm – 5 m in diameter, 10 cm – 20 m long |
| Measuring | Pushed by hand at the recommended speed, with a speed indicator on the display |
| Display | Integrated 3.5″ display with live view |
| Roll identification | Built-in barcode reader or on-screen keyboard |
| Data transfer | Bluetooth or USB-C; no network configuration |
| Companion software | Tapio RollView for Windows and Linux, free and open source |
| Power | Rechargeable battery, charge level on the display; USB-C Power Delivery charging with a compatible charger |
| Operating temperature | 0 – 40 °C |
| Calibration | Factory-calibrated; a calibration check sample (accessory) verifies it, and service and recalibration are available from Tapio and its partners |
| Weight | 1.25 kg |
| Dimensions | 7.3 × 19 × 11 cm (width × length × height) |
Download the RQP Live datasheet (PDF)
RollView software
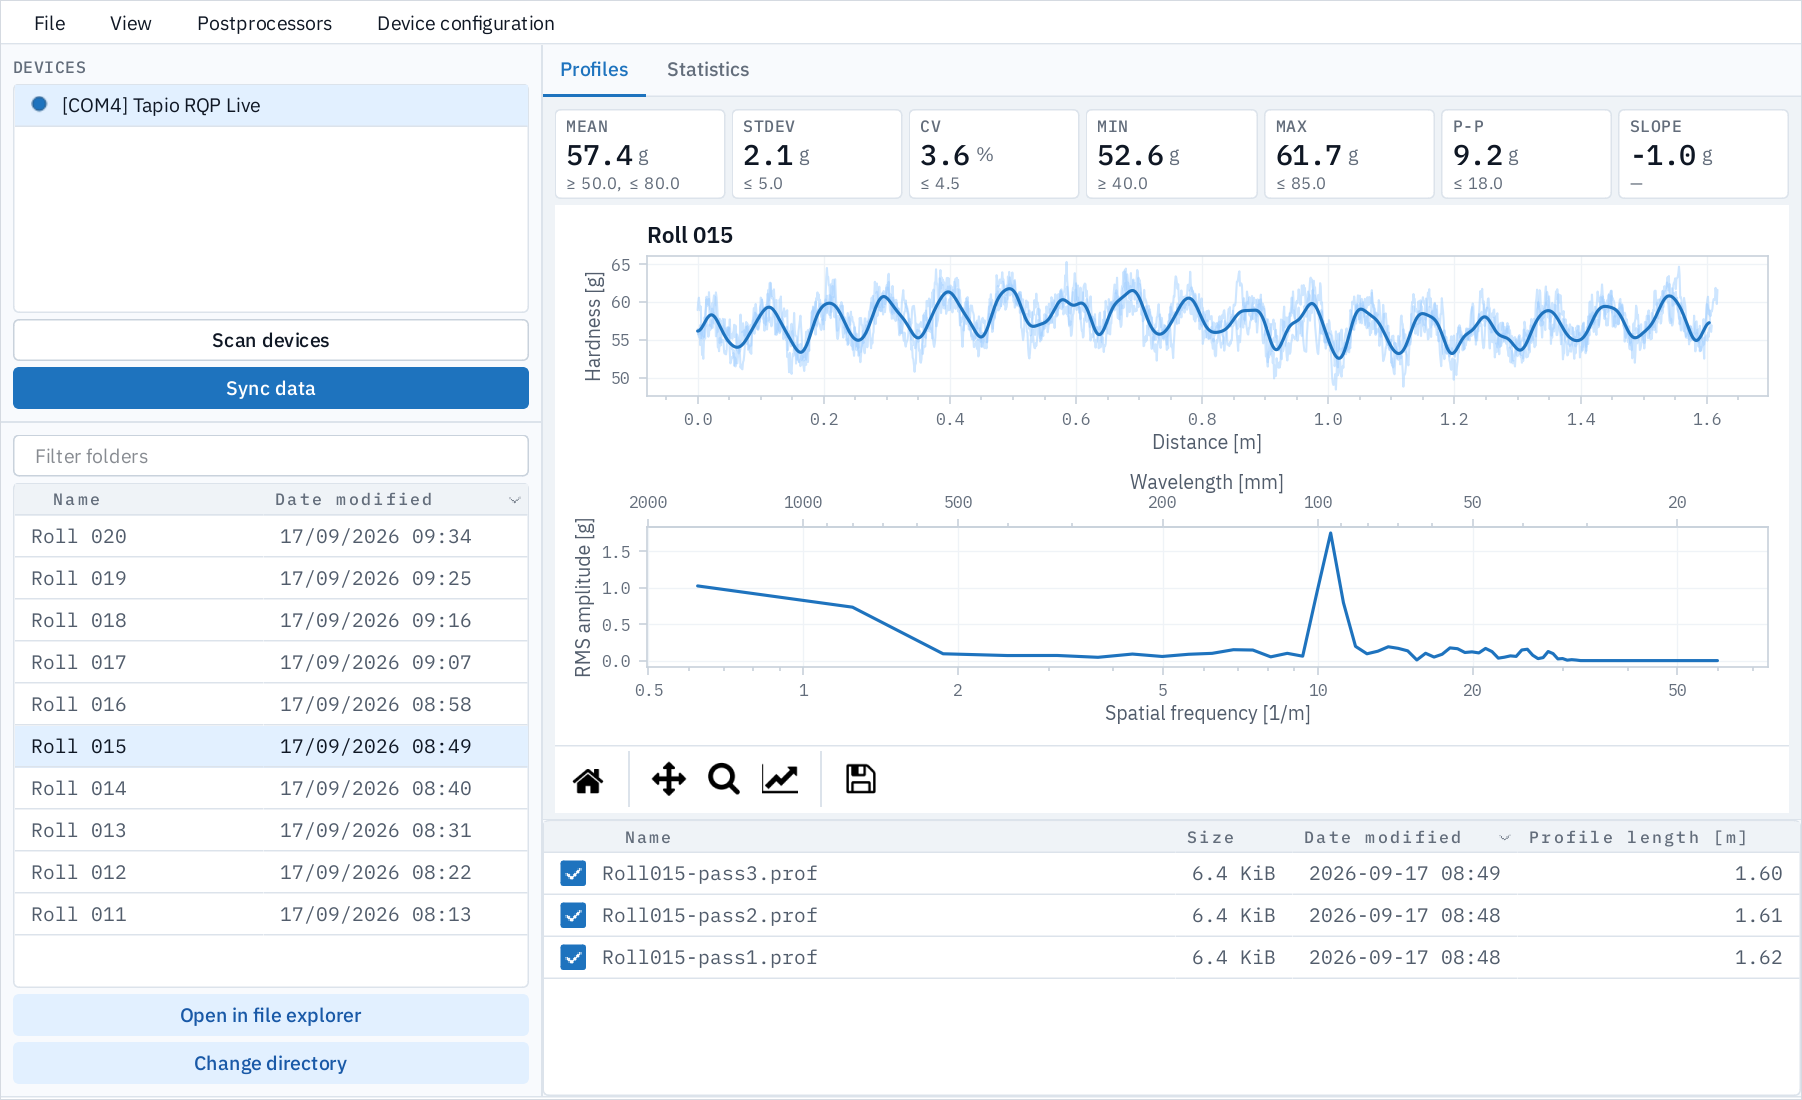
Tapio RollView is included: free, open-source PC software for Windows and Linux. It syncs one or several RQP Live devices, shows every roll with its statistics against your alert limits, and keeps a trend of roll statistics over days and weeks.
- Easily view and compare measured profiles and their statistics.
- Set alert limits, visual limit regions and filtering settings.
- Continuous mode can join the rolls of a winder set into one profile as wide as the parent reel.
- Spectrum view shows the intensity of periodic variation across the roll, for example to study which actuator spacings are causing variation.
- Exclude regions leave the ends or any chosen zone out of the statistics.
- Postprocessors write Excel, JSON and image files, or anything your quality system needs.
Some features, such as automatic synchronization, depend on the RollView and device firmware versions. The manual comes with the software.
RQP Live in use

If you want to understand the real CD profiles of paper and identify the source of variation, Tapio roll hardness measurements are extremely valuable. They reveal systematic process variations that are difficult or impossible to detect with online scanners.
I've used Tapio hardness profilers and saw tremendous value.
Cases and examples

What RQP Live does not do
- It measures hardness. Thickness, tension, density or strength variation can be inferred from a profile, but they are not measured directly.
- A profile supports a quality decision; it cannot guarantee every aspect of roll quality or find every defect.
- The reading comes from the outer part of the roll under the hammer. It is not a layer-by-layer scan, and there is no fixed penetration depth.
- An online scanner measures the moving web and RQP Live the wound roll: the two complement each other. When they disagree, Tapio Analysis can separate the machine-direction (MD) and cross-direction (CD) variation in the laboratory.
Compared with spot checks by hand: Roll hardness profilers compared.
FAQ
What is roll hardness and why does it matter?
Roll hardness describes how tightly the material is wound and reflects the stresses built into the roll. It cannot be judged reliably by eye, yet it affects how the roll behaves downstream.
Both the level and the profile across the roll matter. Variation across the width means uneven tension, and uneven tension can lead to wrinkles, blocking, deformation or edge damage in unwinding, printing or converting.
What causes roll hardness variation?
Mainly the cross-direction profiles of basis weight, moisture and caliper, which change how the material compresses during winding. Winding tension, nip load and torque control contribute, as do disturbances such as speed changes and splices.
How do I tell a good roll from a bad one?
A perfectly uniform roll would give a flat profile. The device reports mean hardness, standard deviation, CV% (coefficient of variation: 100 × standard deviation / mean), minimum, maximum and peak-to-peak (maximum − minimum). In many applications CV% is a good single indicator of uniformity, but acceptable limits have to be set per grade and process, usually from rolls known to have caused problems.
What does the hardness value mean?
Each reading is the peak deceleration of the hammer as it hits the roll, expressed in g: acceleration relative to gravity, not grams of mass. A harder roll stops the hammer faster and gives a higher value. It is not a direct measure of tension, thickness, density or strength. The values are relative, so compare rolls measured with the same kind of device.
Does the measurement damage the roll?
The measurement is designed to be non-destructive. Light marks may sometimes be visible on the surface. Surface sensitivity differs between materials, so check it on your own rolls, for example during a demo or trial.
How deep does it measure?
The reading reflects the outer part of the roll under the hammer; how deep depends on the material and the winding, so there is no fixed penetration depth. Cross-direction variation tends to build up at the same positions layer after layer, which is why the surface profile usually carries the roll's CD pattern. It is not a layer-by-layer scan.
What size rolls can be measured?
Rolls from 10 cm to 5 m in diameter and from 10 cm to 20 m long, for example a 25 cm diameter roll only 10 cm long, or a 3 m diameter roll 10 m long. Tell us about your rolls and we confirm the fit.
How long does one measurement take?
As long as it takes to push the device across the roll at the recommended speed: seconds for a narrow customer roll, around a minute for a machine roll several meters wide.
How are roll IDs and profiles stored?
Each roll gets a folder, named with the barcode reader or the on-screen keyboard. You can measure several profiles into a folder, and the device shows their mean profile and its statistics beside the individual passes. With the Quick measure setting, a folder is created automatically when you press the device onto a roll.
How does the data get to our own systems?
Profiles are synced to a PC with Tapio RollView. Its postprocessors run after every sync and write Excel files and plot images, and JSON if you enable it. Custom postprocessors can convert the data to any format and copy it wherever it is needed.
Is network configuration required?
No. The device does not connect to any network. It talks directly to a computer over Bluetooth, paired like any Bluetooth device, or over the supplied USB-C cable.
How is the battery charged?
Over USB-C with a compatible Power Delivery charger. The charge level is always shown on the display.
How is the device calibrated?
It is factory-calibrated. A calibration check sample, available as an accessory, lets you verify that the calibration has not changed; wear can cause drift over time, and service and recalibration are available from Tapio and its partners.
How do I know a measurement is valid?
Measure the same roll two or three times. The passes should overlay, and the device shows their mean profile.
Does using RQP Live require training?
Basic use is quick to learn. Some training helps with reading the results and knowing what different profile shapes mean in your process.
What does RQP stand for?
Roll Quality Profiler.
Ask about RQP Live
Book an RQP Live demo, ask for a quotation, or ask us to check whether RQP Live suits your rolls. We work with you directly or through one of our local partners.
Tell us about your rolls and what you want to measure. You can also email info@tapiotechnologies.com or choose a demo time from our calendar.