

Article
Understanding paper and board variation, part 1: measuring CD profiles
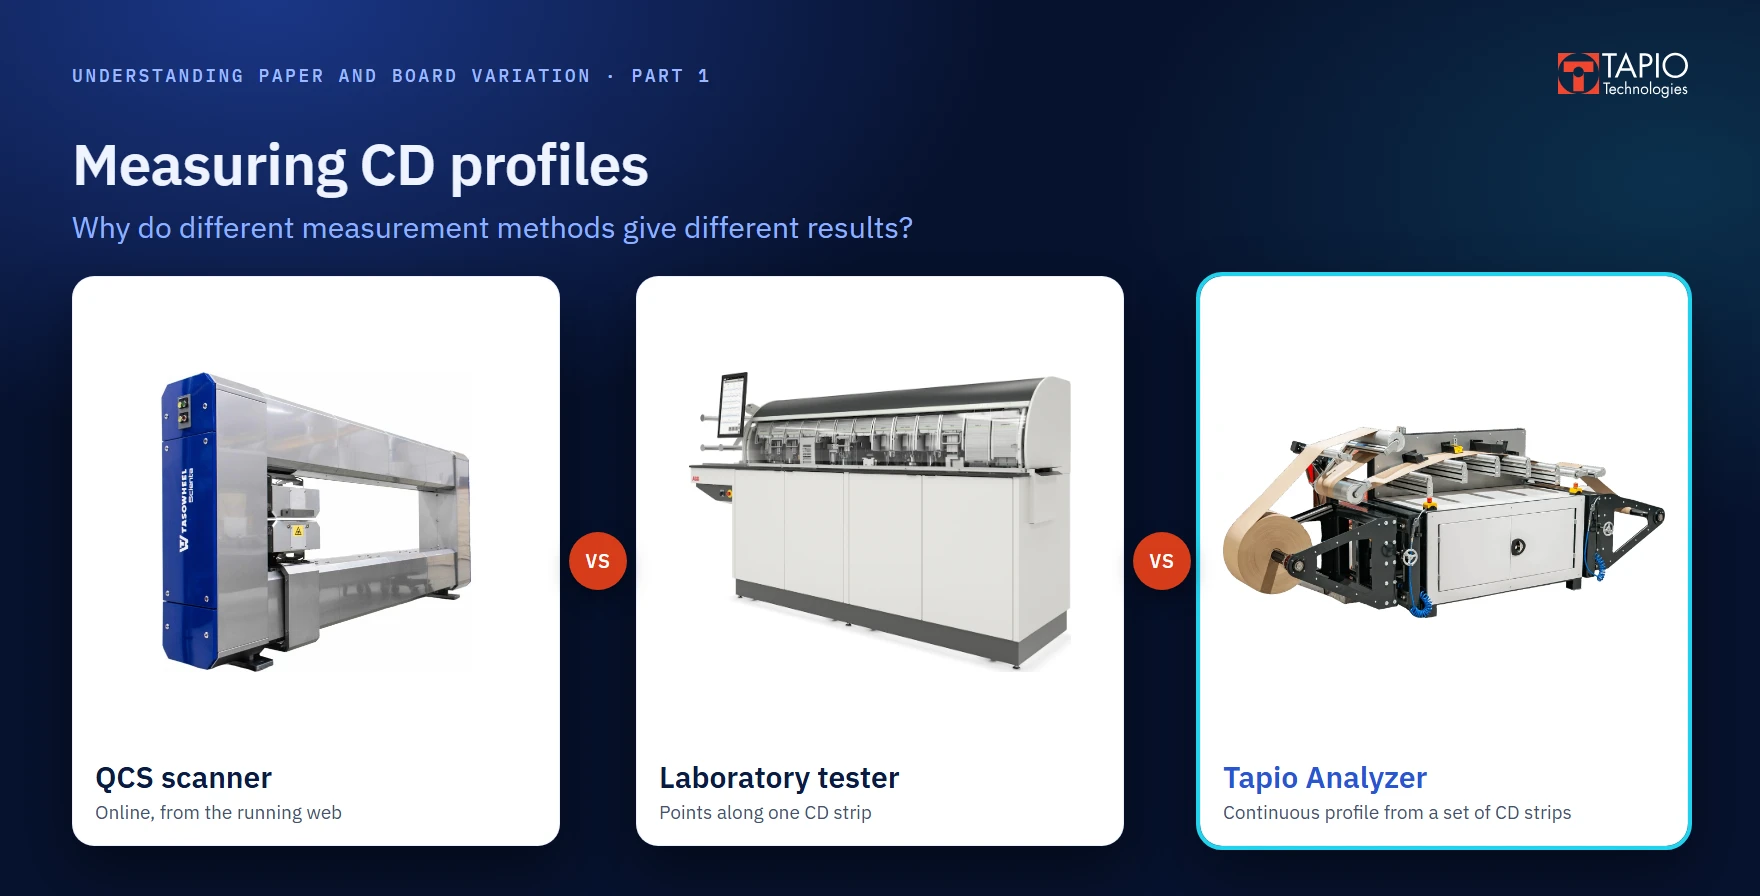
This is the first part of an article series built around practical questions on understanding cross-direction (CD) and machine-direction (MD) variation in paper and board. Most illustrations in this article series are interactive: the sliders change them, and pointing at a plot shows the values.
Two directions on one sheet
Every property of the sheet varies in two directions: along the machine (MD, machine direction) and across it (CD, cross direction). A CD profile is a cut straight across the web, from one edge to the other; an MD profile is a cut along it.
One sheet, two directions
The CD profile shows what differs across the width, such as edges, long waves and streaks. The MD profile shows what changes in time as the sheet is made. CD and MD variation have different causes, so they need to be told apart.
Why do different measurement methods give different results?
A QCS scanner may show a relatively smooth CD profile even when the paper contains narrow streaks or other quality variations. Why does this happen?
Different measurement methods show different aspects of the sheet. A CD profile can be measured in three ways, and the three measure very different things:
- A QCS scanner measures online, on the moving web, providing continuous information for process control. Because the paper moves fast while the scanner crosses the web, QCS systems never measure a true CD profile. MD and CD variation can become mixed in individual scans. Furthermore, because of the high speed and conditions and vibrations in the machine, significant filtering and large sensor apertures are necessary in QCS measurements.
- A laboratory tester measures a strip point by point, providing conventional laboratory measurement properties at selected points across the width; the sampling interval is typically 20 cm or more. These measurements are useful for routine quality control, but variations between the measurement points may remain undetected.
- A Tapio Analyzer measures true CD strips continuously at millimeter resolution, providing several properties (caliper, basis weight, density, etc.) from the same physical spot in paper, non-destructively.
The comparison at the end shows how results from the same paper differ when measured with the different methods. These methods complement each other, and understanding their differences helps explain why some CD problems can be difficult to detect and how additional Tapio CD measurements can provide insight into many production and troubleshooting problems not detectable with other methods.
In this series, the Tapio Analyzer is the instrument; Tapio Analysis is the software that analyzes its measurements, and the name of our laboratory service.
QCS scanner: online, on the moving web
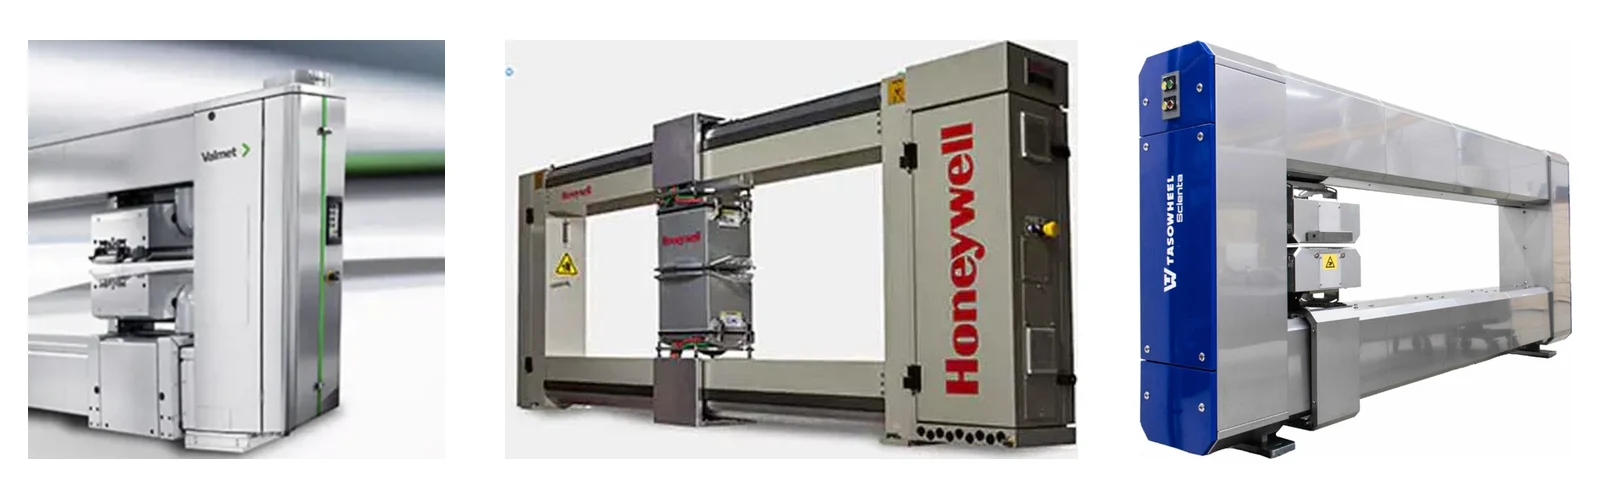
A QCS scanner traverses the web back and forth while the sheet runs under it, so its path over the sheet is a long diagonal. MD variation along that path appears in the scan as if it were CD variation, and the profile shown is an estimate averaged from many scans.
A QCS scanner's path and a CD strip
One scan covers 400 m of MD. Difference from the mean CD profile, RMS: one scan 0.74 g/m².
When more scans are averaged, the estimate comes closer to the mean CD profile, but narrow streaks stay smoothed. The article Hidden variations in paper and board machines describes what this means in practice.
Laboratory tester: point by point along a CD strip
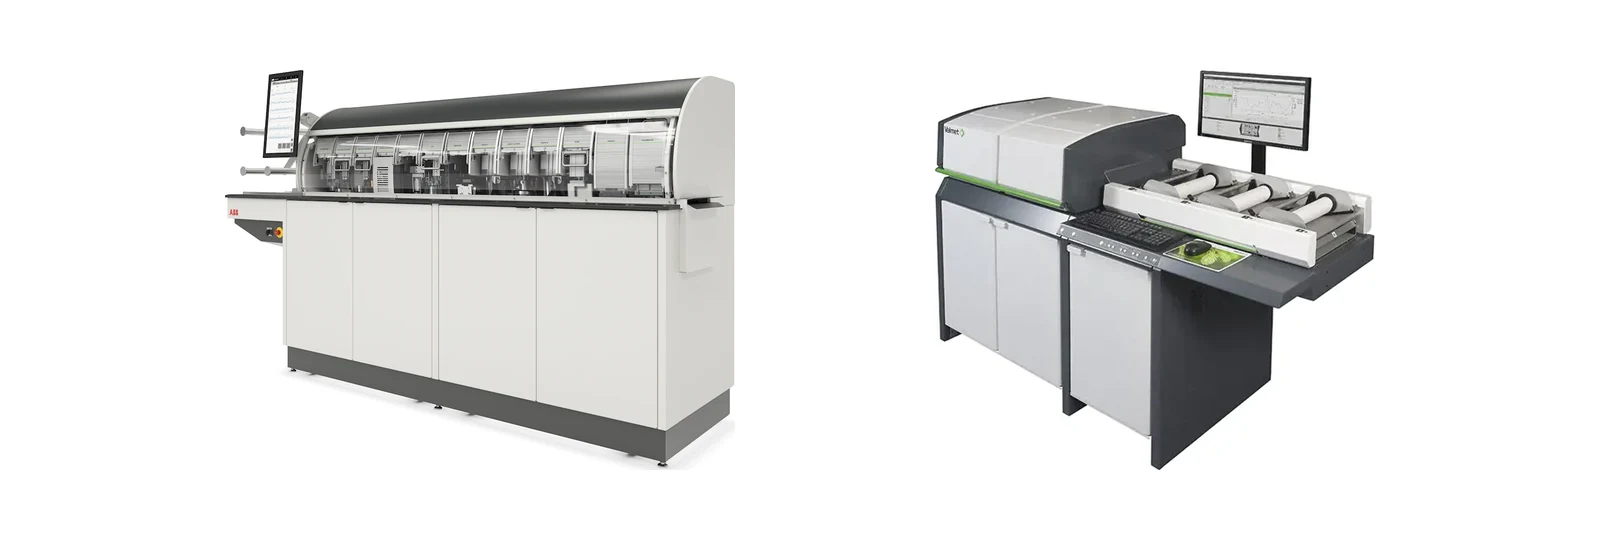
Laboratory testers such as Valmet PaperLab and ABB Autoline measure true CD strips cut across the web, so no MD variation is mixed in. The purpose of these testers is to provide standardized laboratory tests automatically.
When looking at profiles, the drawback of such tests is the destructive nature of many standard paper tests. This means that the profile is known only at the measured points, and which points the measurements happen to hit affects the result significantly.
CD profile statistics from laboratory tester measurements
When the position of the points changes, so does the result. A streak is either missed, and the variation is underestimated, or hit by one point that then counts for 20 cm of the profile, and the variation is overestimated. The lower panel shows this for each statistic as its difference from the true value. With points every 200 mm, the reported range falls short of the true range wherever the points are placed, because they rarely land on the tips of the streaks.
Tapio Analyzer: continuous CD strips at millimeter resolution
A Tapio Analyzer measures true CD strips: full-width strips cut straight across the parent reel, edges included. The strips are taped end to end and wound into a small roll, which runs through the analyzer. The tapes also mark where each strip begins and ends, so Tapio Analysis can separate the strips.
Measuring a set of CD strips on the Tapio Analyzer
As Tapio Analyzer CD strips are cut straight across the web, no MD variation is mixed into the profile. The small measuring apertures and sampling every millimeter or less mean that narrow streaks and short waves are measured accurately.
Basis weight, caliper, ash, gloss, transmission and remission are measured along the same line of the same strip and aligned point by point, and each sensor measures the same physical point in paper. The Tapio measurement is non-destructive, so the strip can be measured again. The measurement runs at a slow, controlled speed in the laboratory, without the heat and vibration of a running machine.
The three methods compared
The figure below measures one sheet in the three ways.
One CD profile, three ways to measure it
RMS difference from the CD profile: QCS scanner 0.46, laboratory tester 0.61, Tapio Analyzer 0.06 g/m².
The QCS scanner comes close to the long waves of the profile but stays smooth where the profile has short features: the ripple is gone and the streaks are low and wide. The laboratory tester draws the profile between its points, and whether a streak shows depends on where they fall. The Tapio Analyzer follows the profile, ripple and streaks included.
| QCS scanner | Laboratory tester | Tapio Analyzer | |
|---|---|---|---|
| Where | On the machine, online | Laboratory | Laboratory |
| Path across the web | Diagonal, MD mixed in | Straight across a strip | Straight across a strip |
| Resolution across the web | Smoothed by spot size and averaging | The point spacing | Continuous, millimeter-level |
| Standard laboratory instrument measurements | No | Yes | No |
| Strips per reel | Many scans, averaged | Usually one | A set, typically 20 or more |
| Profile stability | Not separated from MD variation | Not known from one strip | Measured |
| Several properties | Along the same diagonal path, typically offset by the construction of the sensor head: not the same spot in the paper | From separate test pieces | From the same spot, aligned point by point |
| The sample afterwards | Not sampled | Consumed by the tests | Intact, can be measured again |
All three measurements are needed and they complement each other. The QCS scanner watches the machine during production; the laboratory tester gives the standard properties for each reel, while the Tapio Analyzer can show CD profiles in unparalleled detail to determine how stable they are, so narrow streaks, periodic CD variations, edge problems and unstable profiles can be seen and traced to their source.
The high-resolution data measured with a Tapio Analyzer from a set of CD strips can also be used for the CD variance analysis of TAPPI T 545 and for spectral analysis, which are both available as features in the Tapio Analysis software. These are covered in the next parts of this series.
Send us your CD strips or MD rolls for measurement. Request an analysis, or see how to prepare the samples: for a CD analysis we ask for at least 20 full-width strips from the same parent reel.
Send us your samples
Send us MD rolls or CD strips. You get the measured profiles, a report of the findings and a review with a Tapio specialist.