

Tapio Analyzers · laboratory instrument
Laboratory analyzers for paper, board, tissue and nonwovens
Measure continuous machine-direction (MD) and cross-direction (CD) profiles in your own laboratory, with the readings of every sensor aligned to the same positions on the sheet. For laboratories, process engineers, quality and R&D.
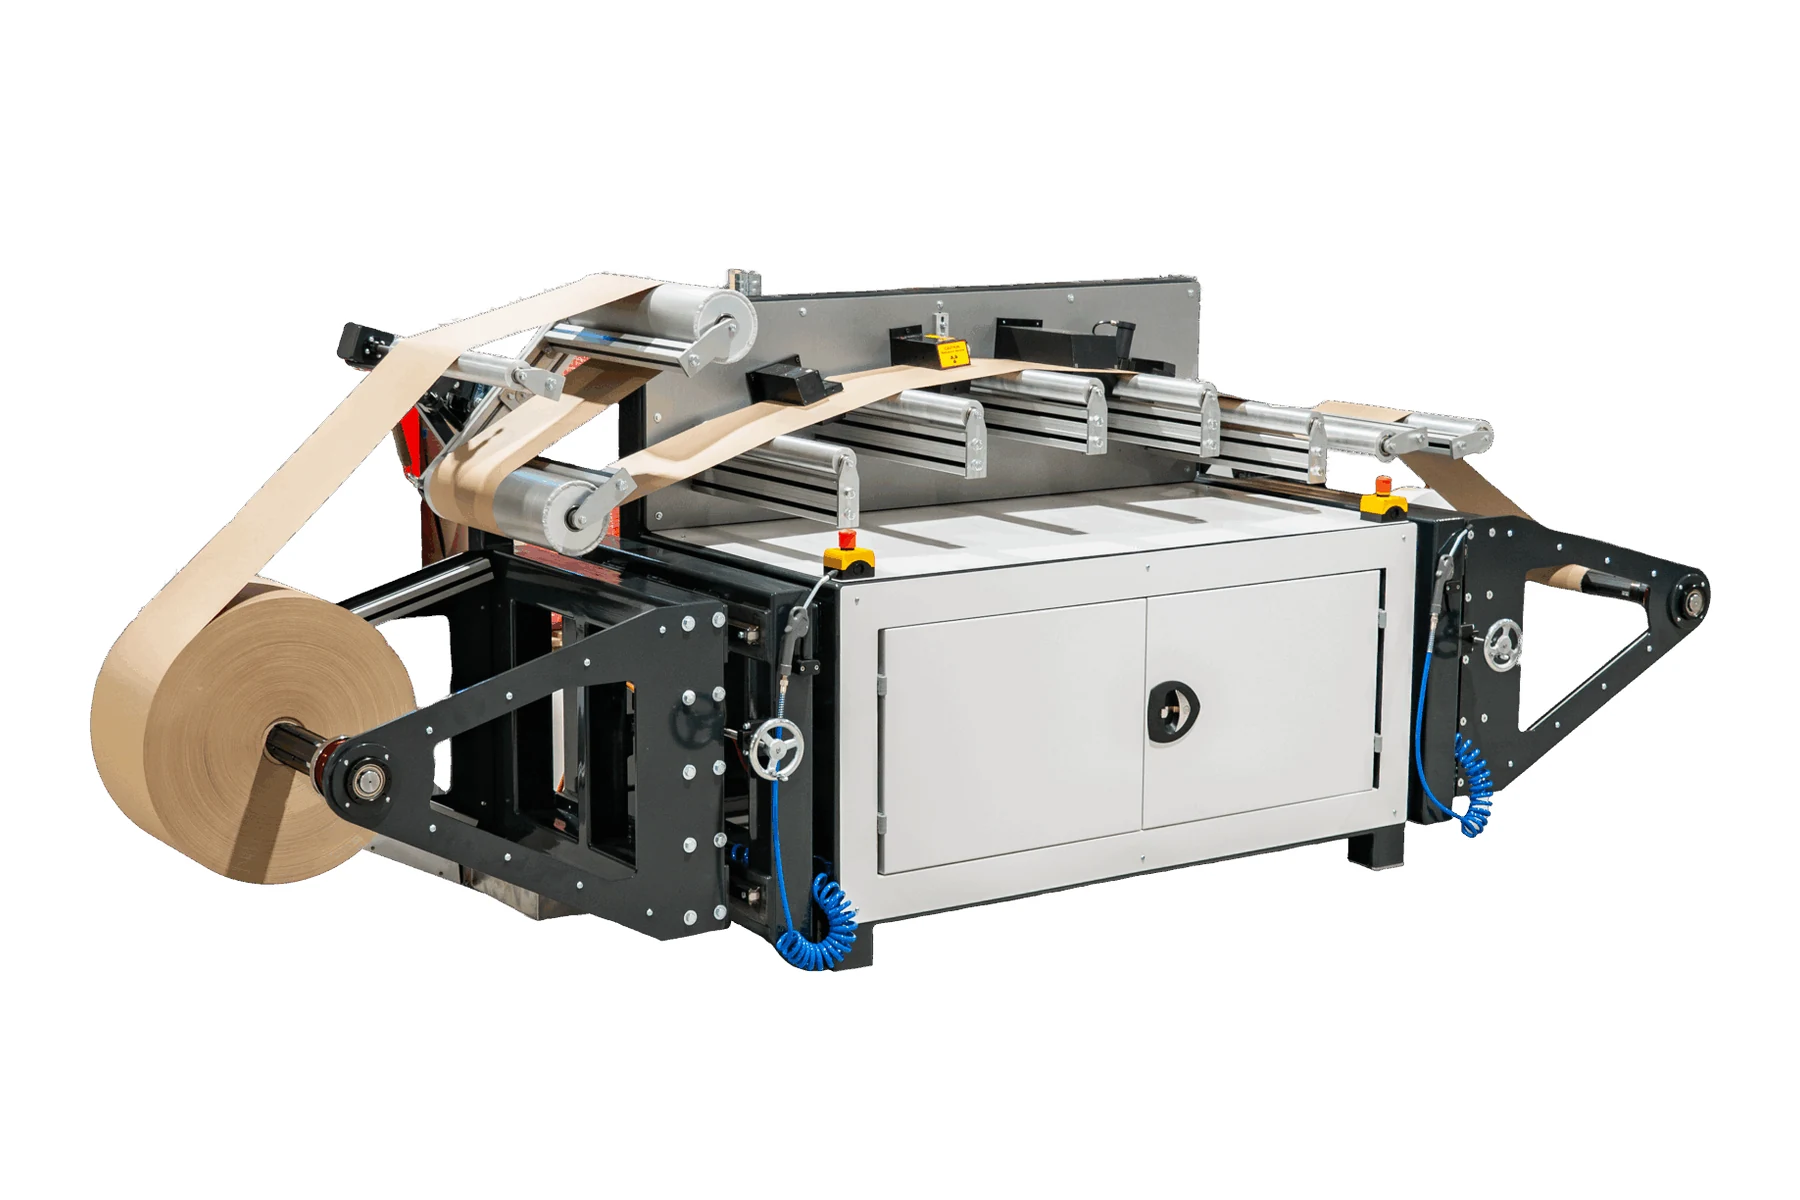
An instrument for your own laboratory. Would you rather send samples than run an analyzer yourself? The Tapio Analysis service measures your samples in our laboratory on the same kind of instrument and reviews the findings with you.
Tapio Analyzers in the mill laboratory
Paper, board, tissue and nonwoven manufacturers who want continuous property profiles from their own samples, measured in their own laboratory. A Tapio Analyzer records profiles of basis weight, caliper, gloss, ash, transmission and other properties from the same strip of paper: kilometers of it from one MD sample roll, or a set of full-width CD strips taped into a small roll for a profile across the web.
Laboratories
Continuous profiles and spectra instead of single values, with every channel read from the same strip, and reports generated from the data.
Process engineers
Investigate the likely sources of MD and CD variation, compare machine data with the measured wavelengths, and check the effect of a change.
Quality and R&D
Compare grades, machines, trials and suppliers, follow quality over time, and support development work.
Unique measurement principles of a Tapio Analyzer
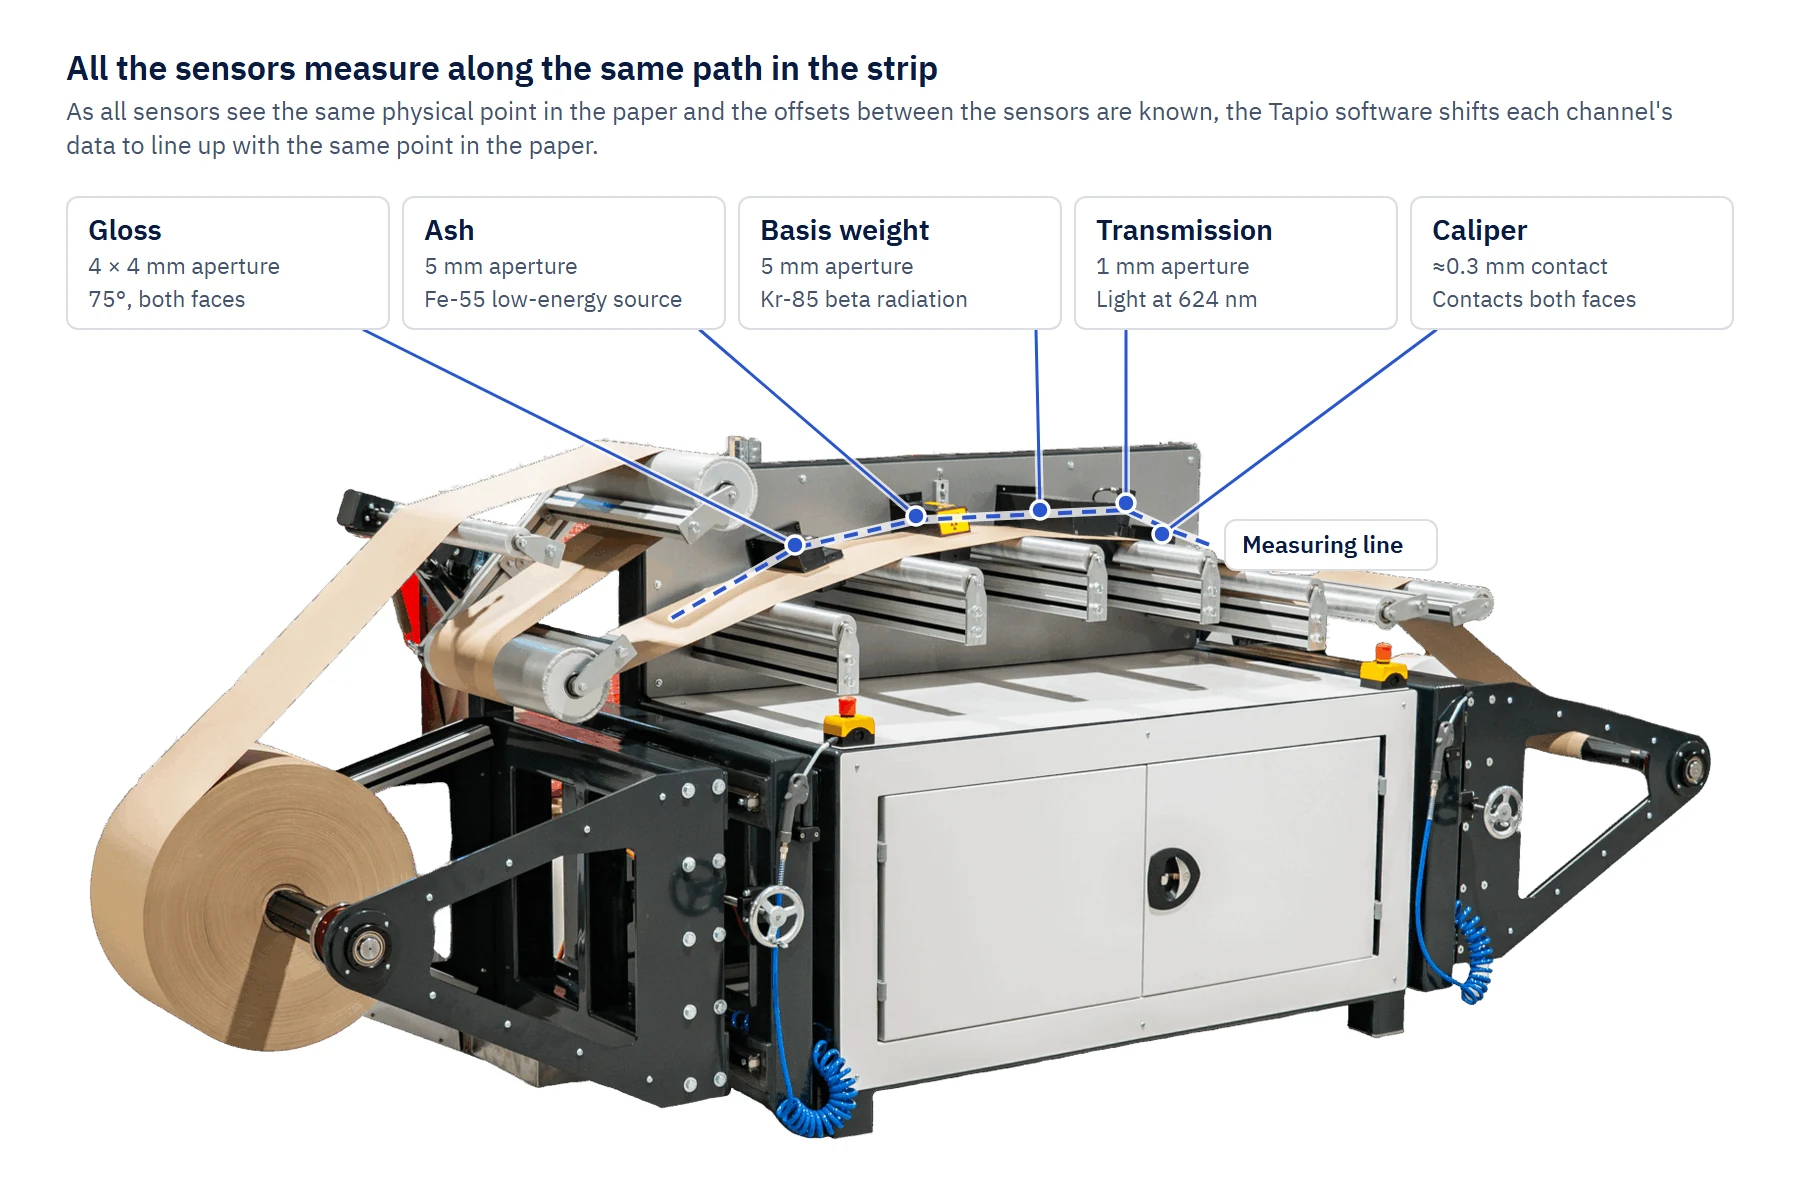
- Small apertures. The strip moves at a controlled 0.1 m/s or 1 m/s, so the sensors can use small measuring spots, 5 mm for basis weight and ash, 4 × 4 mm for gloss and 1 mm for transmission, and still integrate long enough for a stable reading.
- High-resolution sampling. Every channel is recorded at a 1000 Hz sampling rate, which is a raw spacing of 0.1 mm at 0.1 m/s and 1 mm at 1 m/s. A 100 Hz low-pass filter sets the effective measurement resolution: 1 mm at 0.1 m/s and 10 mm at 1 m/s.
- All sensors on one measuring line. The sensors sit on one line along the strip at known distances from each other. The software shifts each channel by its sensor's offset, so the readings of all sensors correspond to the same point on the sheet, even though the sensors do not measure at one physical spot at the same moment. Any two properties can be correlated point by point.
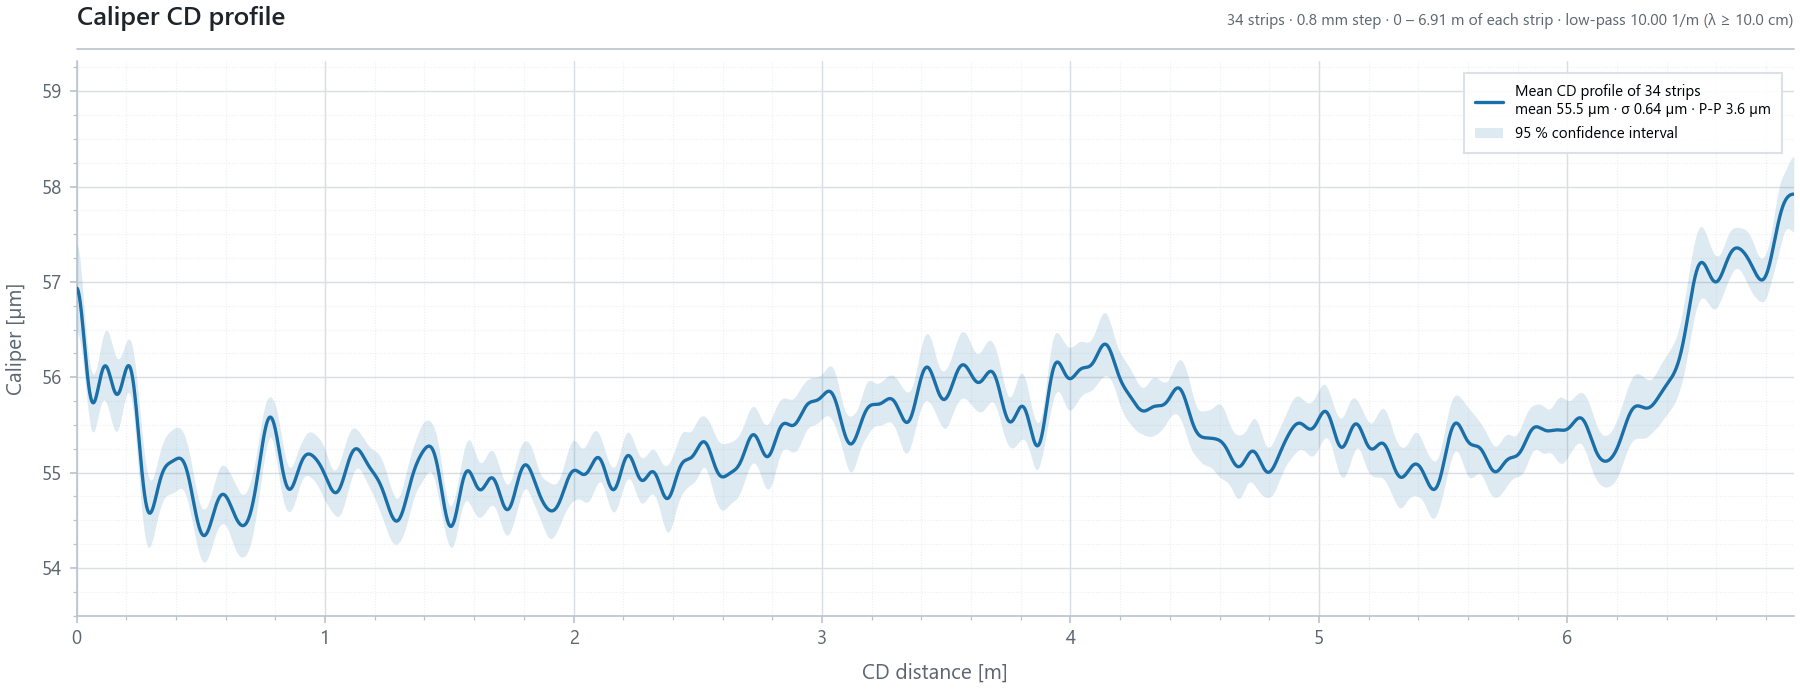
- True CD profiles. Full-width CD strips are taped into a small roll and measured across the whole width, with the very edges included. Unlike traversing online scanners, where MD variation distorts the profiles, in a Tapio Analyzer the CD profile is measured directly and its stability from strip to strip is known.
Sensors and channels
The standard configuration measures caliper, basis weight, ash, gloss on both sides and transmission. Other sensors are available on request: remission, porosity and custom sensors with a voltage or current output.
The two plots below are from a real Tapio Analyzer measurement: six channels over the same five meters of one MD sample, and ash plotted against basis weight point by point.
Example: high-resolution MD measurement · Machine 3
Example: ash against basis weight point by point · Machine 3
Example of a high-resolution MD measurement, 5 m shown. The channels are aligned in software to the same positions on the sheet, and the channels a feature appears in can be used for diagnostics. Where caliper moves and basis weight does not, the thickness change came without extra mass, which suggests that the variation originates in pressing or calendering. Where transmission moves with basis weight, the variation is likely in the mass. Plotted against each other, two channels show how closely they are linked, for example whether ash follows the basis weight variation or varies on its own. The spectra of the channels then show at which wavelengths each property varies.
Problems a Tapio Analyzer helps investigate
- Periodic MD variation such as barring, and its candidate sources on the machine
- CD profiles measured straight across the web, including the edges
- Formation and floc size from the transmission signal
- Comparison of online QCS profiles with laboratory CD profiles
- Checking the effect of a headbox change, a rebuild or a new online measurement
- Differences between grades, machines, trials and suppliers
- Quality over time, and the real variation behind your quality limits
- Development work on new grades
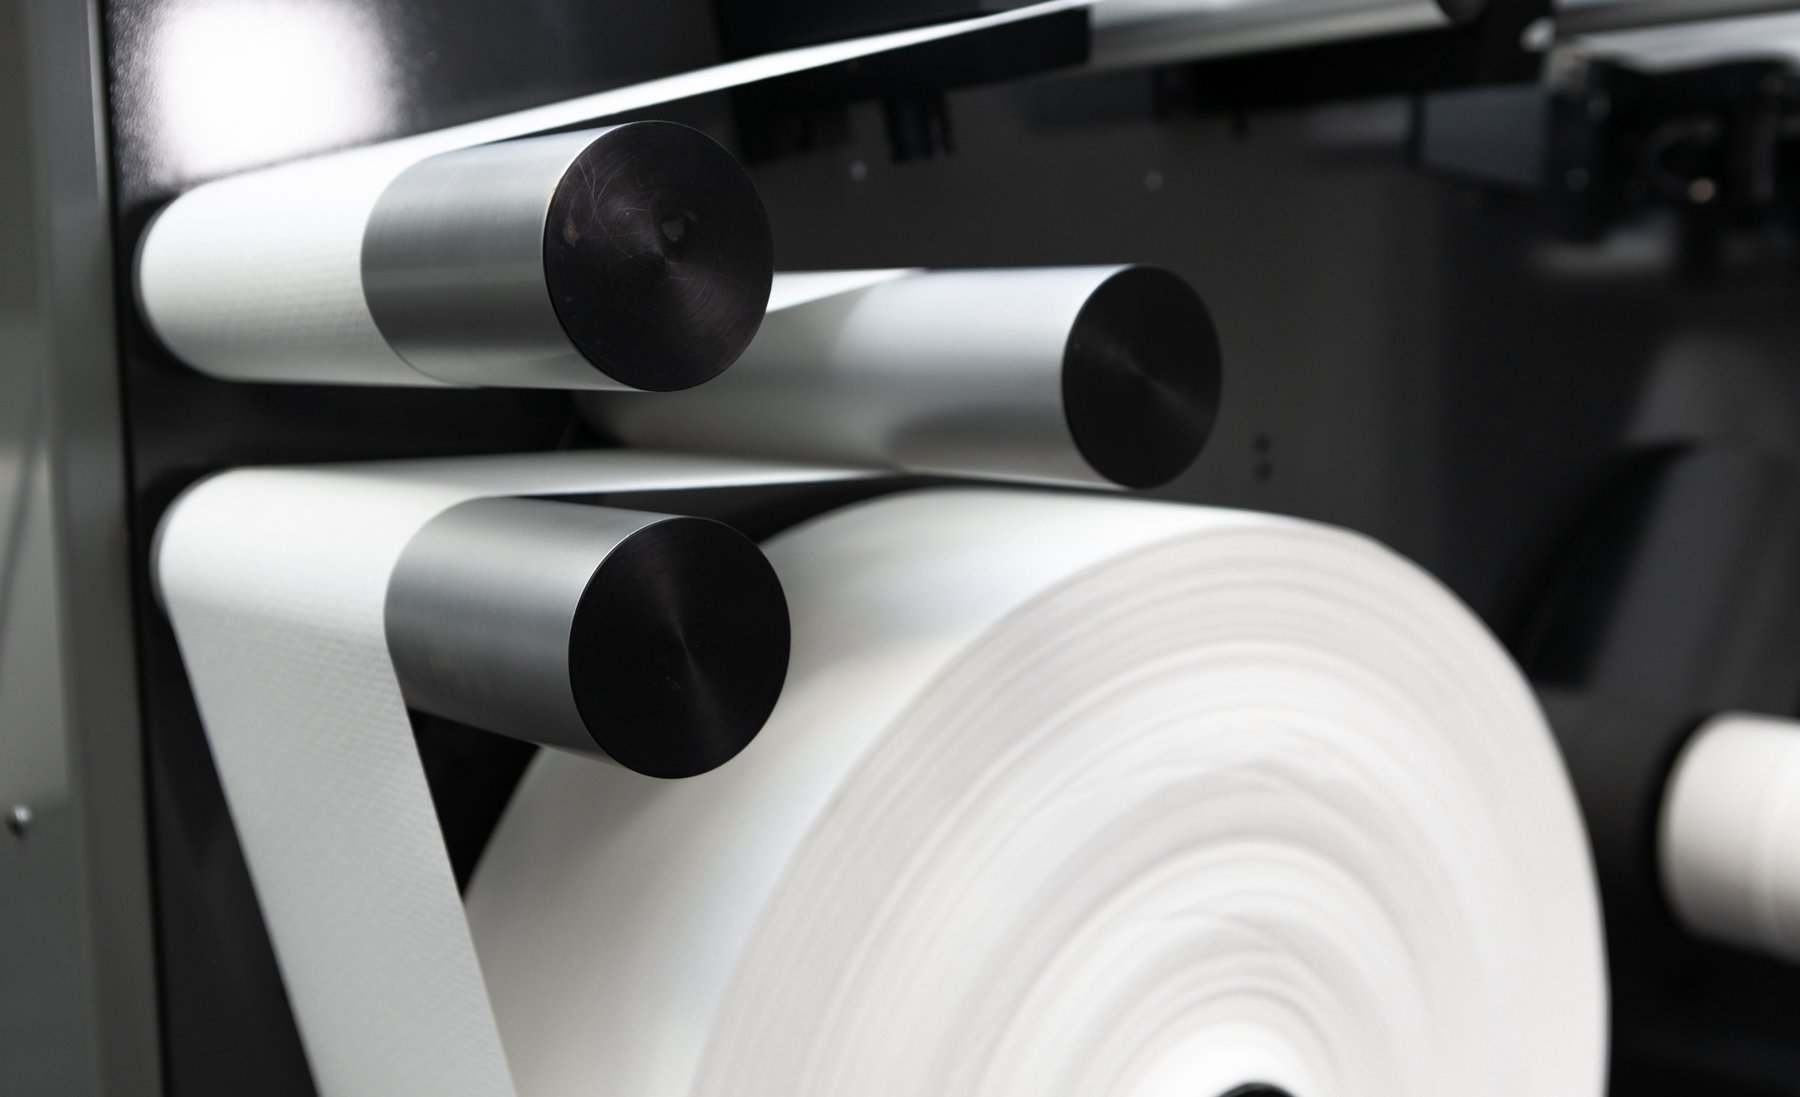
Two types of samples: MD rolls and CD strips
| MD sample roll | CD strips | |
|---|---|---|
| Sample | A narrow sample roll cut at the winder, typically several kilometers of paper | Several full-width strips from one parent reel, taped end to end into a small sample roll |
| What it covers | Variation along the machine direction over a long stretch of production | A CD profile straight across the full width, edges included, without MD variation mixed in |
| Typical questions | Which roll, felt, wire or pump could be behind a periodic variation? Is barring or winder vibration in the product? | Is the variation at actuator spacing? How do the edges behave? Does the scanner profile agree? |
| Analysis | Profiles at several scales, spectrum and spectrogram with machine element matching, correlation between channels, formation and flocs | CD profile, CD spectrum with actuator spacings, variance analysis, CD correlation, scanner overlay |
CD strips are trimmed to width and taped together to form a small roll for measurement. The software finds the tapes in the signal, splits the record into strips and lines them up across the web. The CD analysis uses both the mean CD profile and the individual profiles: repeat strips separate the repeatable CD shape from strip-to-strip variation, and the variance analysis splits the variation into MD, CD and residual parts, a general paper machine quality metric for comparisons.
The system
A Tapio Analyzer is an instrument and two separate programs. Tapio Analysis is also the name of our troubleshooting and quality comparison service.
Tapio Analyzer
The instrument: sample roll holder, web transport at a controlled speed, and a row of sensors chosen for your grades.
Tapio Measurement
The instrument-control software. It runs the analyzer, handles the calibration of each sensor and records every channel into one data file.
Tapio Analysis
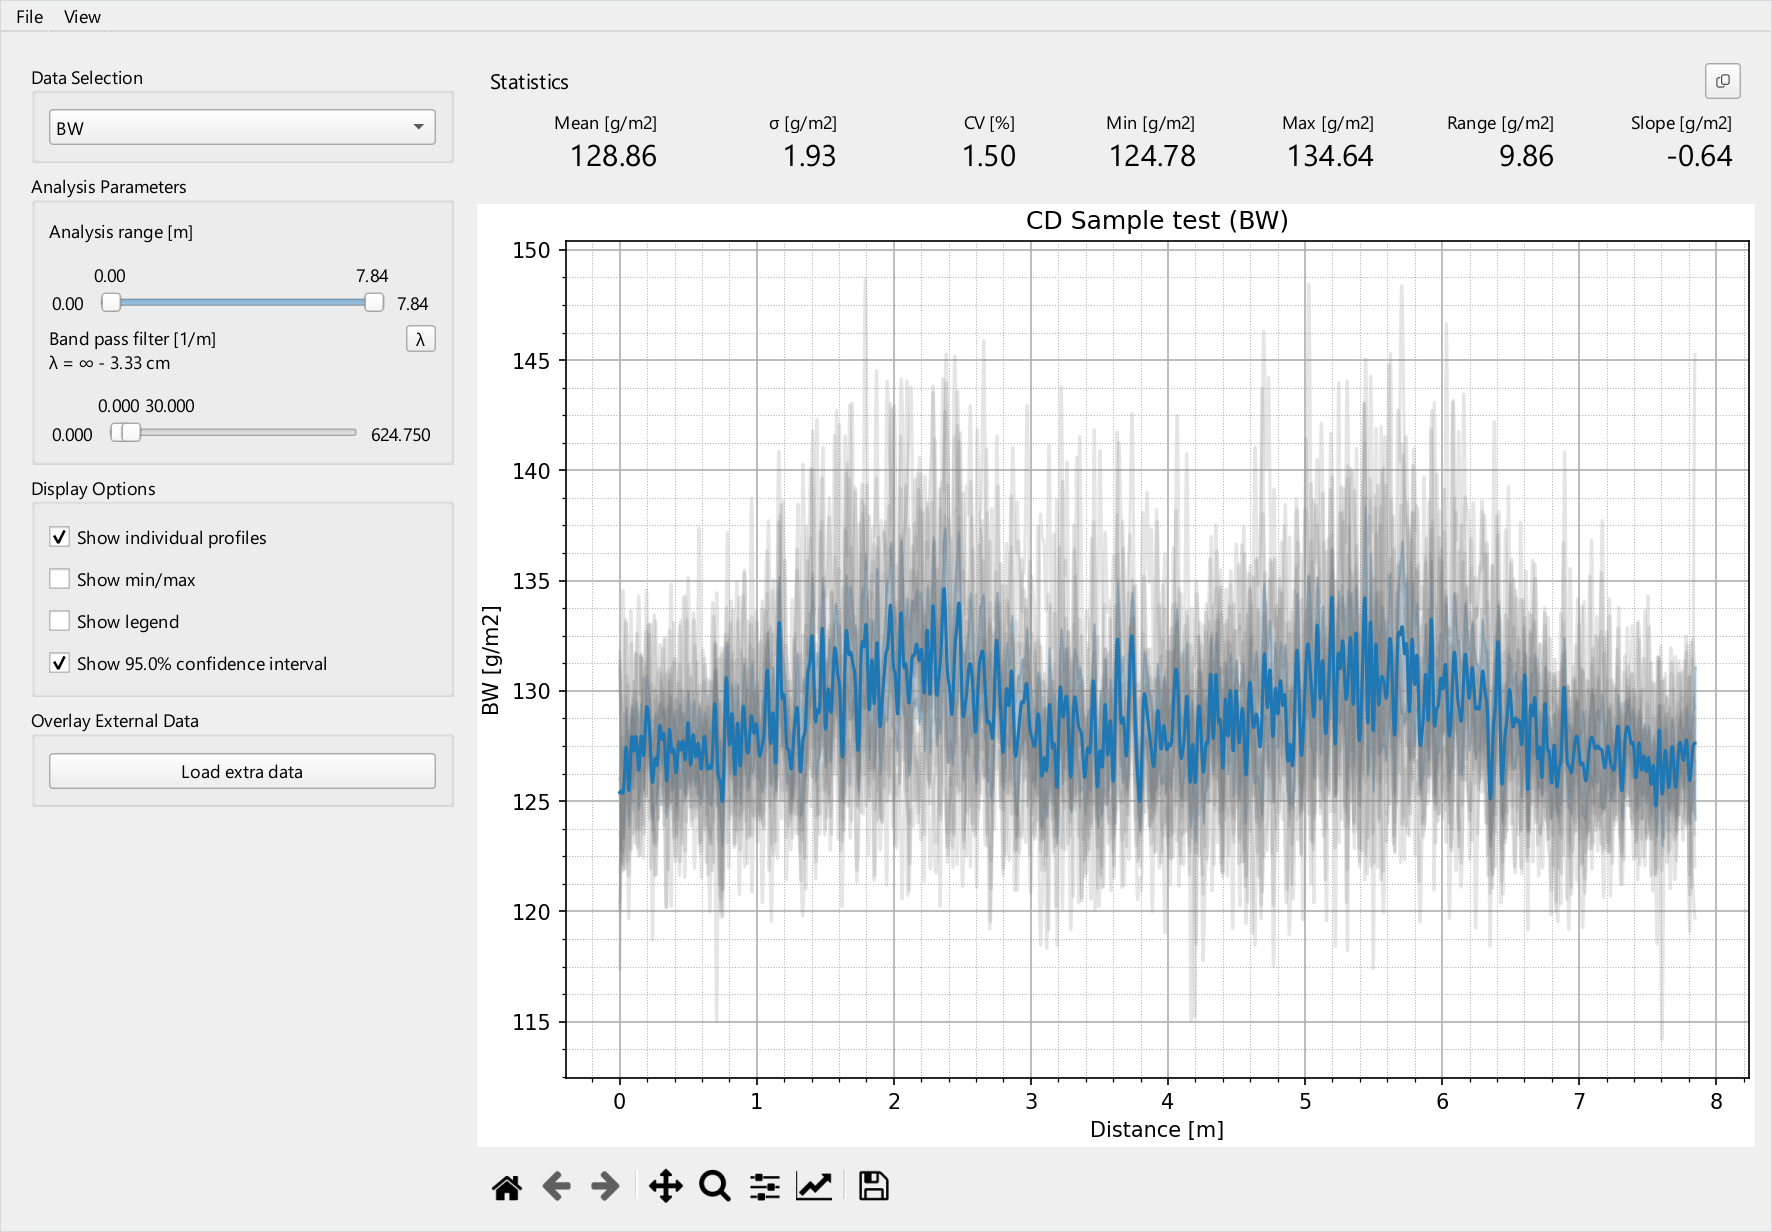
The analysis software, free and open source (GPL) for Windows, with flexible tools for filtering, visualization and studies of the data: profiles, spectra and spectrograms, coherence and correlation, formation and flocs, variance components and machine element matching. It also generates the MD and CD reports.
From measurement to report
Tapio Analysis generates the reports automatically: MD reports with statistics at several low-pass cutoffs and a list of the most significant spectral peaks, and CD reports with the profile, statistics, variance analysis and CD spectrum. Custom loaders read other profile data such as online scanner data, and reports can be adapted to your needs.
Download Tapio AnalysisMachine element matching in practice
Examples
Troubleshooting coated board or fine paper
Basis weight, caliper, transmission, ash and gloss on both faces, with density, bulk and relative ash derived from them. It separates mass from thickness from surface: whether a caliper variation comes with basis weight variation or without it, and whether it shows on one face only.
Tissue and other light grades
Basis weight and caliper carry the analysis; on a tissue base sheet, transmission, ash and gloss give little usable signal. Repeat full-width strips show how much of the variation is a repeatable CD profile and how much changes from strip to strip, and the MD roll shows how caliper wanders over hundreds of meters.
Tapio Analysis is our primary tool to measure and find sources of quality variations that other measuring systems cannot detect. The results show precise machine elements to be fixed or serviced and therefore reduce guessing during production. Tapio Analysis is our primary diagnostics support tool.
Tapio Analysis laboratory measurements reveal real MD and CD variation that online scanners cannot always detect. They are an excellent tool for troubleshooting paper machine quality problems.
More articles
Specifications
| Tapio Analyzer | |
|---|---|
| Samples | MD sample rolls are cut at the winder or with a roll saw and typically consist of kilometers of paper; CD strips are cut to width and taped into a small sample roll for measurement |
| Sample roll capacity | Web width up to 50 cm and roll mass up to 350 kg, held on pneumatic chucks. Maximum roll diameter: ask us for your configuration |
| Sensors | Up to 16. Standard configuration: caliper, basis weight, ash, gloss on both sides and transmission. On request: remission, porosity and custom sensors with a voltage or current output |
| Derived channels | Density, bulk and relative ash, calculated from the aligned measured channels |
| Sampling | 1000 Hz on every channel: a raw spacing of 0.1 mm at 0.1 m/s and 1 mm at 1 m/s |
| Effective resolution | 1 mm at 0.1 m/s and 10 mm at 1 m/s, set by the 100 Hz low-pass filter; each channel is further limited by its sensor's aperture |
| Materials | Paper, board, tissue and nonwoven samples; other web materials checked case by case |
| Software | Tapio Measurement (instrument control, calibration, measurement) and Tapio Analysis (analysis and reports) |
| Upgrading | Sensors from an older Tapio PMA analyzer can be transferred to the new analyzer |
Basis weight
Beta radiation (Kr-85), 5 mm aperture.
Caliper
Contacting from top and bottom, contact area about 0.3 mm across.
Gloss
Both faces at the standard 75° angle, 4 × 4 mm aperture.
Ash
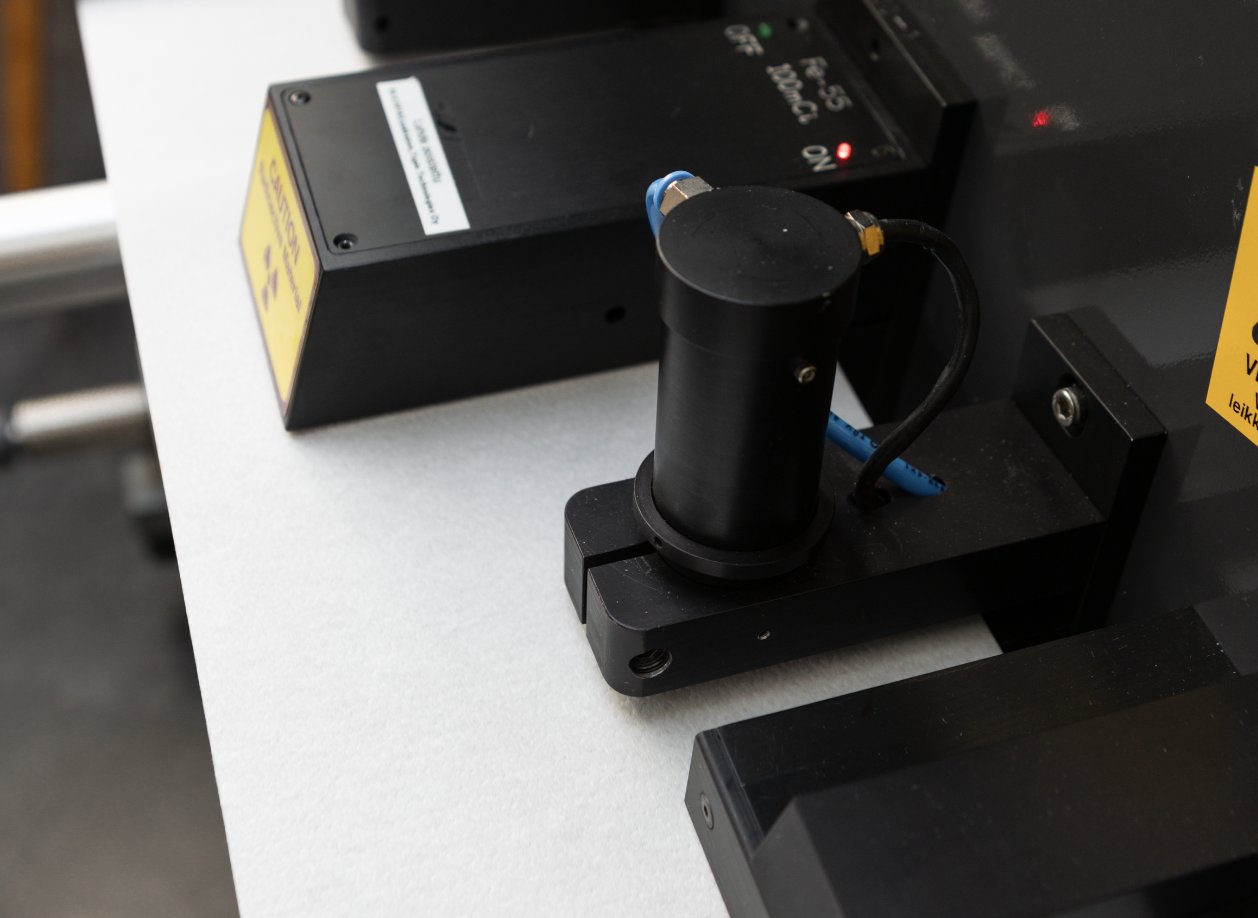
An attenuation measurement (Fe-55 source) sensitive to the mineral content; 5 mm aperture.
Transmission
Light at 624 nm, 1 mm aperture; optical formation and floc size.
Remission
Brightness variation, 0.3 mm aperture. Option.
Porosity
Air permeability under constant pressure. Option, for grades where it applies.
Derived channels
Density, bulk and relative ash from the same positions: derived, not independent measurements.
FAQ
Should we buy an analyzer or use the service?
Buy an analyzer when you measure regularly, want profiles as part of routine quality work, or need results without shipping samples. Use the Tapio Analysis service for an occasional problem, a comparison or a trial, or to see what the measurement shows about your paper before deciding on an instrument of your own.
Which sensors do we need?
It depends on your grades and questions. Basis weight and caliper are the core of almost every configuration; transmission adds formation and a fine-scale view of the mass; ash and gloss on both faces separate filler, coating and surface effects. Tell us what you want to measure and we suggest a configuration.
What resolution do the measurements have?
The analyzer samples every channel at 1000 Hz, which at the 0.1 m/s measurement speed is a raw spacing of 0.1 mm and at 1 m/s a spacing of 1 mm. The 100 Hz low-pass filter limits what the data can resolve to an effective measurement resolution of about 1 mm at 0.1 m/s and about 10 mm at 1 m/s. The effective resolution of each channel also depends on its sensor's aperture, from about 0.3 mm for caliper to 5 mm for basis weight and ash.
Is the sampling interval the same as the resolution?
No. A sensor cannot see structure much smaller than its measuring spot. Caliper, with a contact area of about 0.3 mm, resolves detail that basis weight, with a 5 mm aperture, averages away, whatever the sampling interval.
Can our older Tapio analyzer be upgraded?
Sensors from an older Tapio PMA analyzer can be transferred to the new analyzer. Tell us what you have and we look at the options.
Is the software free?
Tapio Analysis, the analysis software, is free and open source, and it also reads data from Tapio Analysis service projects. Tapio Measurement, the instrument-control software, comes with the analyzer.
Can the analysis prove what causes a variation?
It shows where and at which wavelengths the variation occurs and which channels carry it, and it can match a wavelength with candidate machine elements. A match or a correlation is evidence of a likely source, not proof: confirming it takes a check on the machine.
Discuss an analyzer
Tell us about your grades, the properties you want to measure and the questions you want answered. We suggest a sensor configuration and answer your questions about the instrument.
You can also email info@tapiotechnologies.com. Want to send samples instead? Request analysis.