

Article
Find likely machine-element sources with Tapio MD Analysis
During a shutdown, several components are replaced. But how do you know which one actually caused the problem? In many cases, recurring machine-direction variation continues after maintenance, because the root cause was not correctly identified.
In paper, board, and other continuous production processes where the product is formed by rolling or pressing, any rotating element affecting the web, such as a roll, felt, wire or pump, can leave a repeating pattern related to quality variation on the final product. These periodic patterns can manifest as variations in thickness, basis weight, ash content, density, porosity, gloss, brightness or other appearance properties.
Tapio machine direction analysis
Tapio MD Analysis is a powerful, high resolution tool designed to detect and analyze these periodic patterns. By measuring the product properties along the machine direction and applying spectral (frequency domain) analysis, Tapio MD Analysis can pinpoint repeating defects with high precision.
When roll diameters or rotational speeds are provided, our open-source software Tapio Analysis will automatically suggest which spectral peaks (wavelengths and frequencies of variations) most closely match the given machine elements. This feature makes it much faster and more intuitive for operators and engineers to identify candidate mechanical sources of recurring defects.
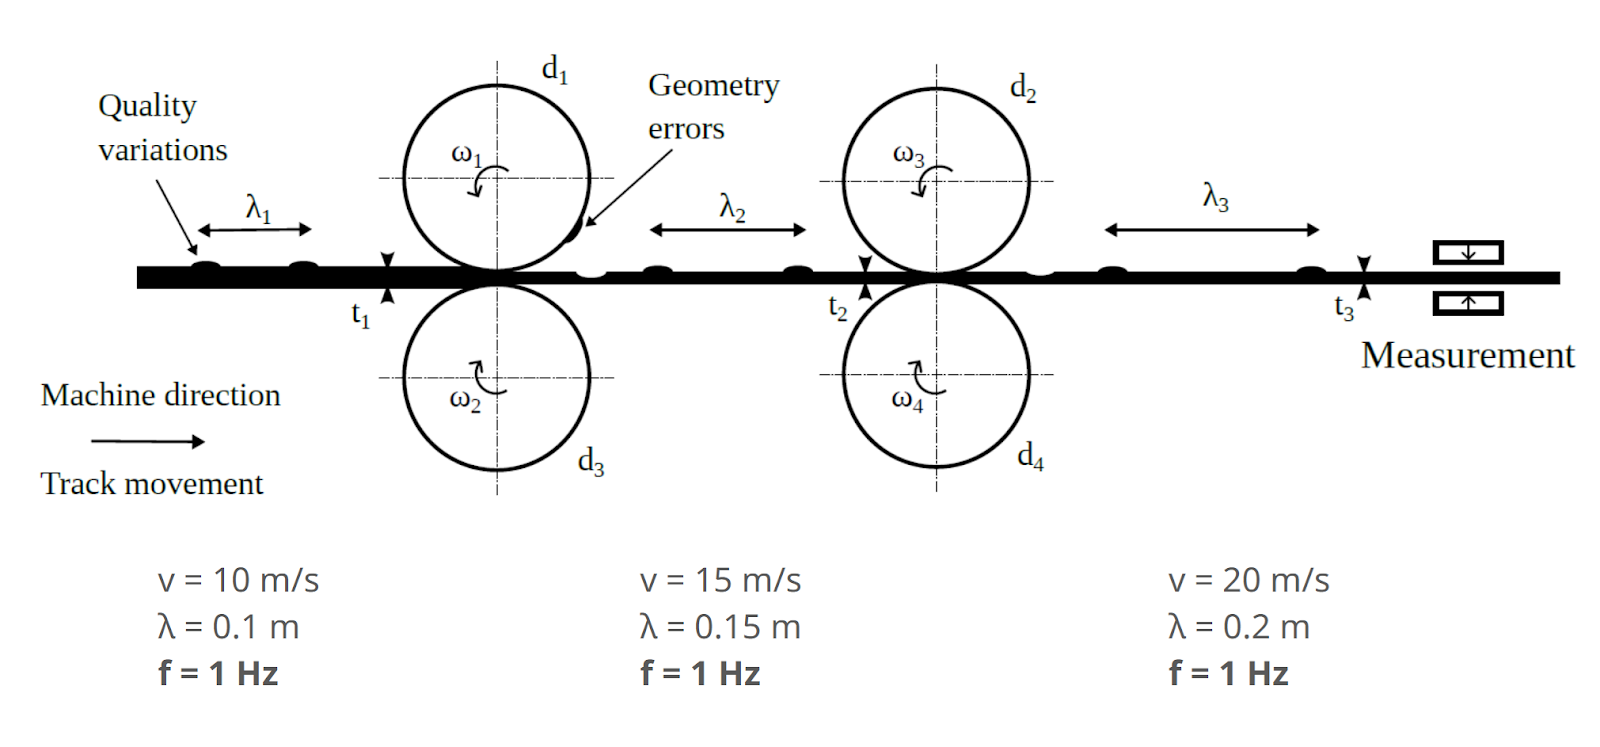
Figure: “One Hertz in Paper”. The diagram illustrates the relationship between machine speed, defect wavelength, and temporal frequency. As the web speed changes, through acceleration or stretching along the production line, the wavelength of periodic defects increases proportionally. However, the temporal frequency, the rate at which defects pass a fixed point, remains constant. Understanding this behavior is essential for correctly linking detected patterns to machine elements.
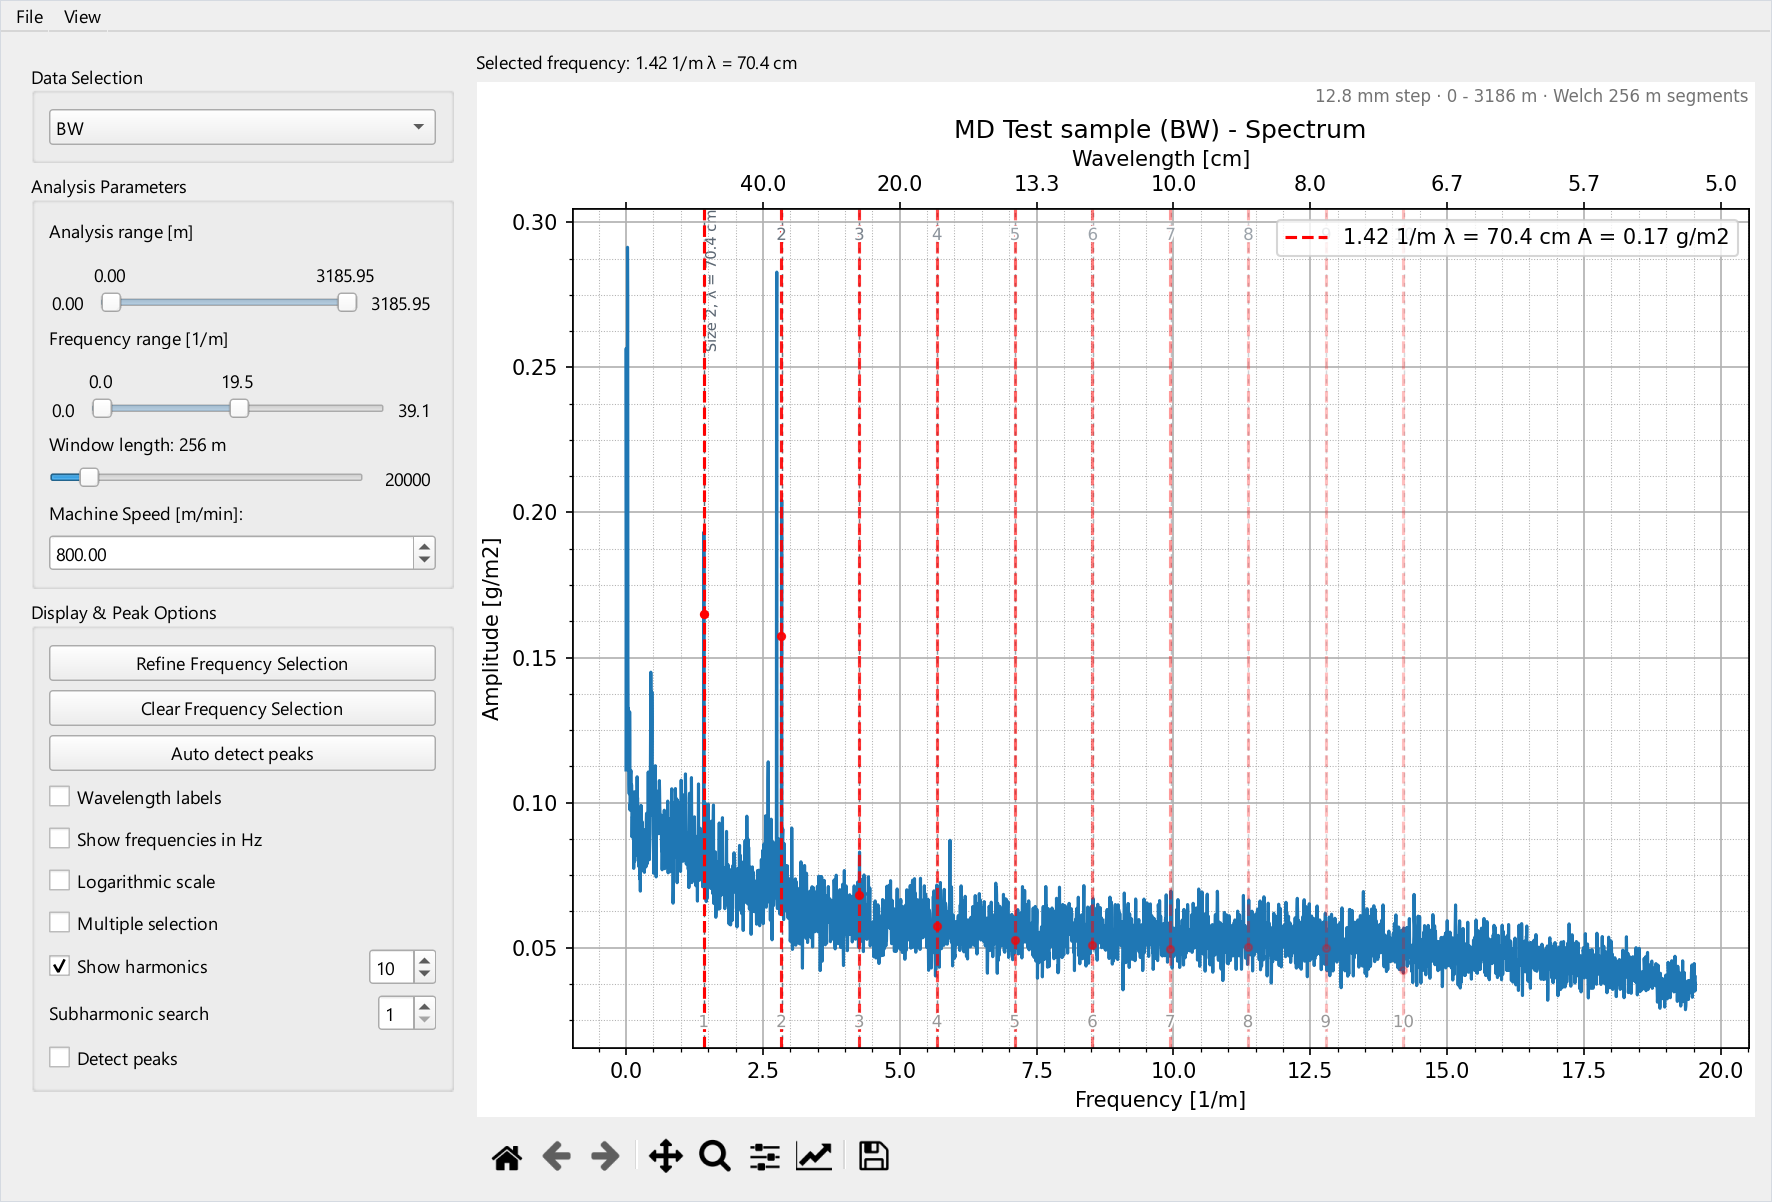
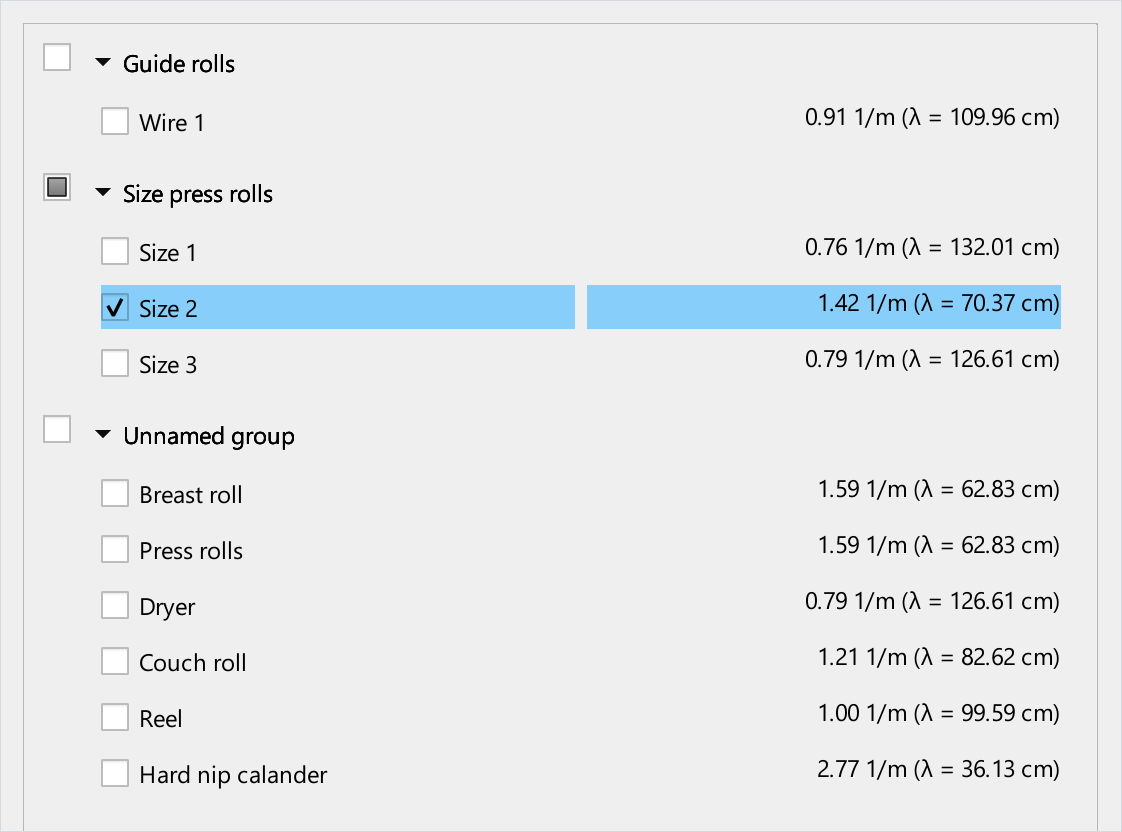
Figure: Machine element matching in Tapio Analysis
When given roll diameters or rotational speeds, Tapio Analysis can automatically suggest which spectral peaks (rotating frequencies and wavelengths) have the closest match to the provided machine elements. This speeds up troubleshooting and supports targeted maintenance by highlighting candidate rolls whose frequencies match the strongest spectral peaks.
Narrowing down the source with Tapio Analysis
Beyond just identifying the frequency, deeper analysis is possible by using the channel-specific information available from Tapio Measurements. Tapio Analyzers record several sensor channels aligned to the same positions in the paper; aperture and effective resolution vary by sensor.
Available sensors include:
- Basis weight
- Caliper
- Ash content
- Gloss (both sides)
- Transmission
- Remission (optical brightness)
- Porosity
Additional channels, such as density, bulk and relative ash, are calculated by combining the data from several sensors.
By analyzing in which measured property (channel) the fault appears, and studying correlations between channels, it becomes possible to narrow down the likely source of the problem, using reasoning that depends on knowledge of the specific production line:
- Basis weight defects typically originate from the wet end of the paper machine, where the basis weight is formed.
- If ash content is not evenly distributed relative to basis weight (poor correlation), the source may lie in the coating stations.
- Gloss variations that occur at the same frequencies as thickness variations usually indicate problems originating from the calendering sections, as in calender barring.
By combining frequency and correlation analysis with reasoning based on the defect type and measurement channel, maintenance and troubleshooting efforts can be much more targeted and effective.
Key benefits of Tapio MD analysis
- Fast identification of periodic defects.
- Direct display of fault frequency (Hz) for easy matching to machine components.
- Automatic suggestions for likely problematic machine elements based on size and speed data.
- Better-targeted maintenance and troubleshooting
Have your paper or board analyzed
- As the Tapio Analysis service, Tapio offers sample preparation, measurement, analysis and reporting, with a discussion session with the Tapio team
- Just send us your samples: Sample requirements.
- We also accept hand-cut CD strips and we can get MD rolls cut for measurement on a winder.
Talk to us about your measurement
Sensors, analyzer configurations, software or analysis methods: tell us what you need to measure.