

Downloads
Software downloads
Tapio RollView (for RQP Live) and the Tapio Analysis software (for Tapio Analyzers and analysis-service data) are free and open source. Both run as a single program file on Windows, with nothing to install. PapEye applications are licensed separately.
Tapio RollView
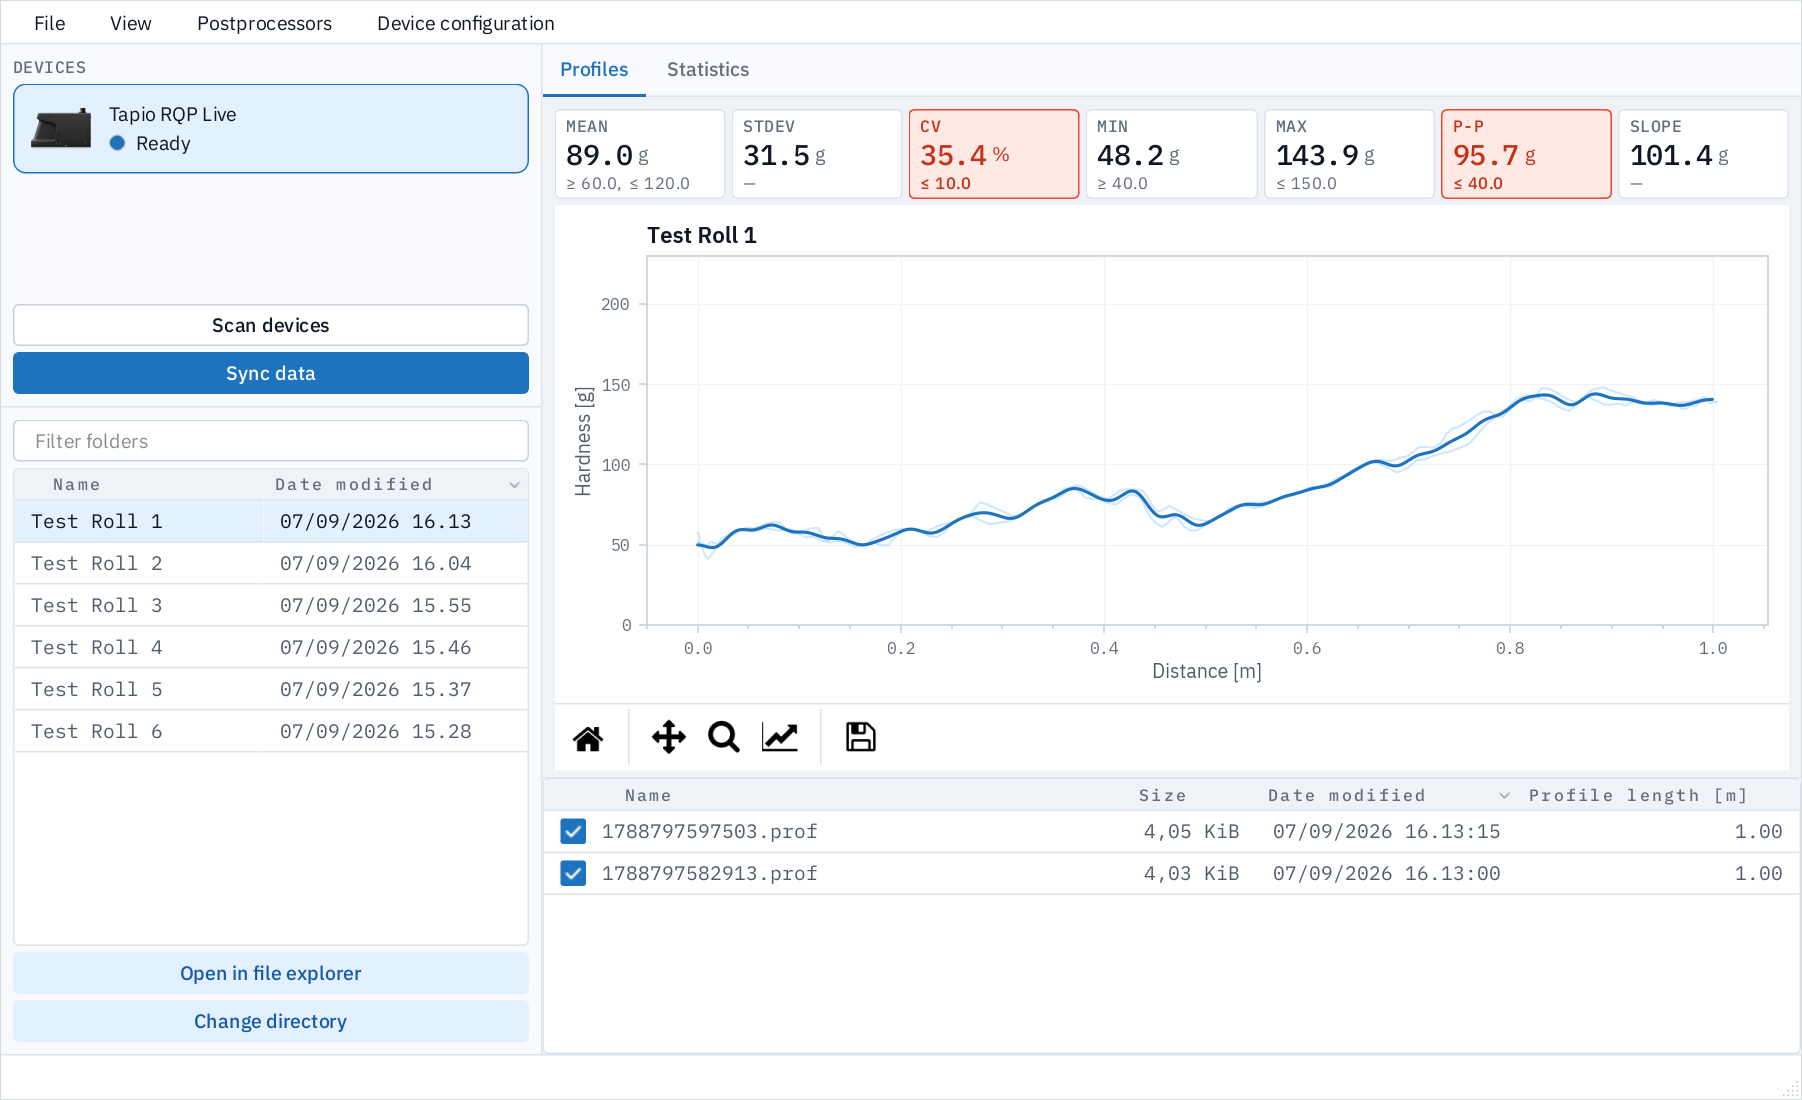
The PC software for the Tapio RQP Live roll hardness profiler. It syncs the devices, shows every roll against your alert limits and passes the data on to your quality systems.
- Sync: transfer folders from one or several RQP Live devices over Bluetooth or USB. Verified files are removed from the device, and the device clock is set from the PC.
- Statistics: mean, standard deviation, CV%, minimum, maximum, peak-to-peak and slope, each with its own alert limits.
- Continuous mode: the rolls of a winder set shown side by side as one profile, as wide as the parent reel.
- Spectrum: periodic hardness variation across the roll, with the wavelength on the axis.
- Exclude regions: leave the roll ends, or any zone you choose, out of the statistics.
- Trend: one point per roll over the last week, the last month or all data.
- Postprocessors: Excel files and plot images after every sync, JSON if you enable it, and custom postprocessors for any other format or destination.
| Tapio RollView | |
|---|---|
| Used with | Tapio RQP Live roll hardness profilers |
| Version | 1.6.4 (September 2026); the download page always has the latest release |
| Release notes, file size and checksums | On the download page, for every release |
| Runs on | Windows (single program file, no installation) and Linux |
| License | Free and open source (GPL v3) |
| Languages | English and Japanese |
| Documentation | Manual included with the software; support from info@tapiotechnologies.com |
| Getting started | RQP Live tutorial videos |
| Device settings | QR codes for alert limits and other settings from RollView or the RQP Live Configurator |
A typical RollView workflow
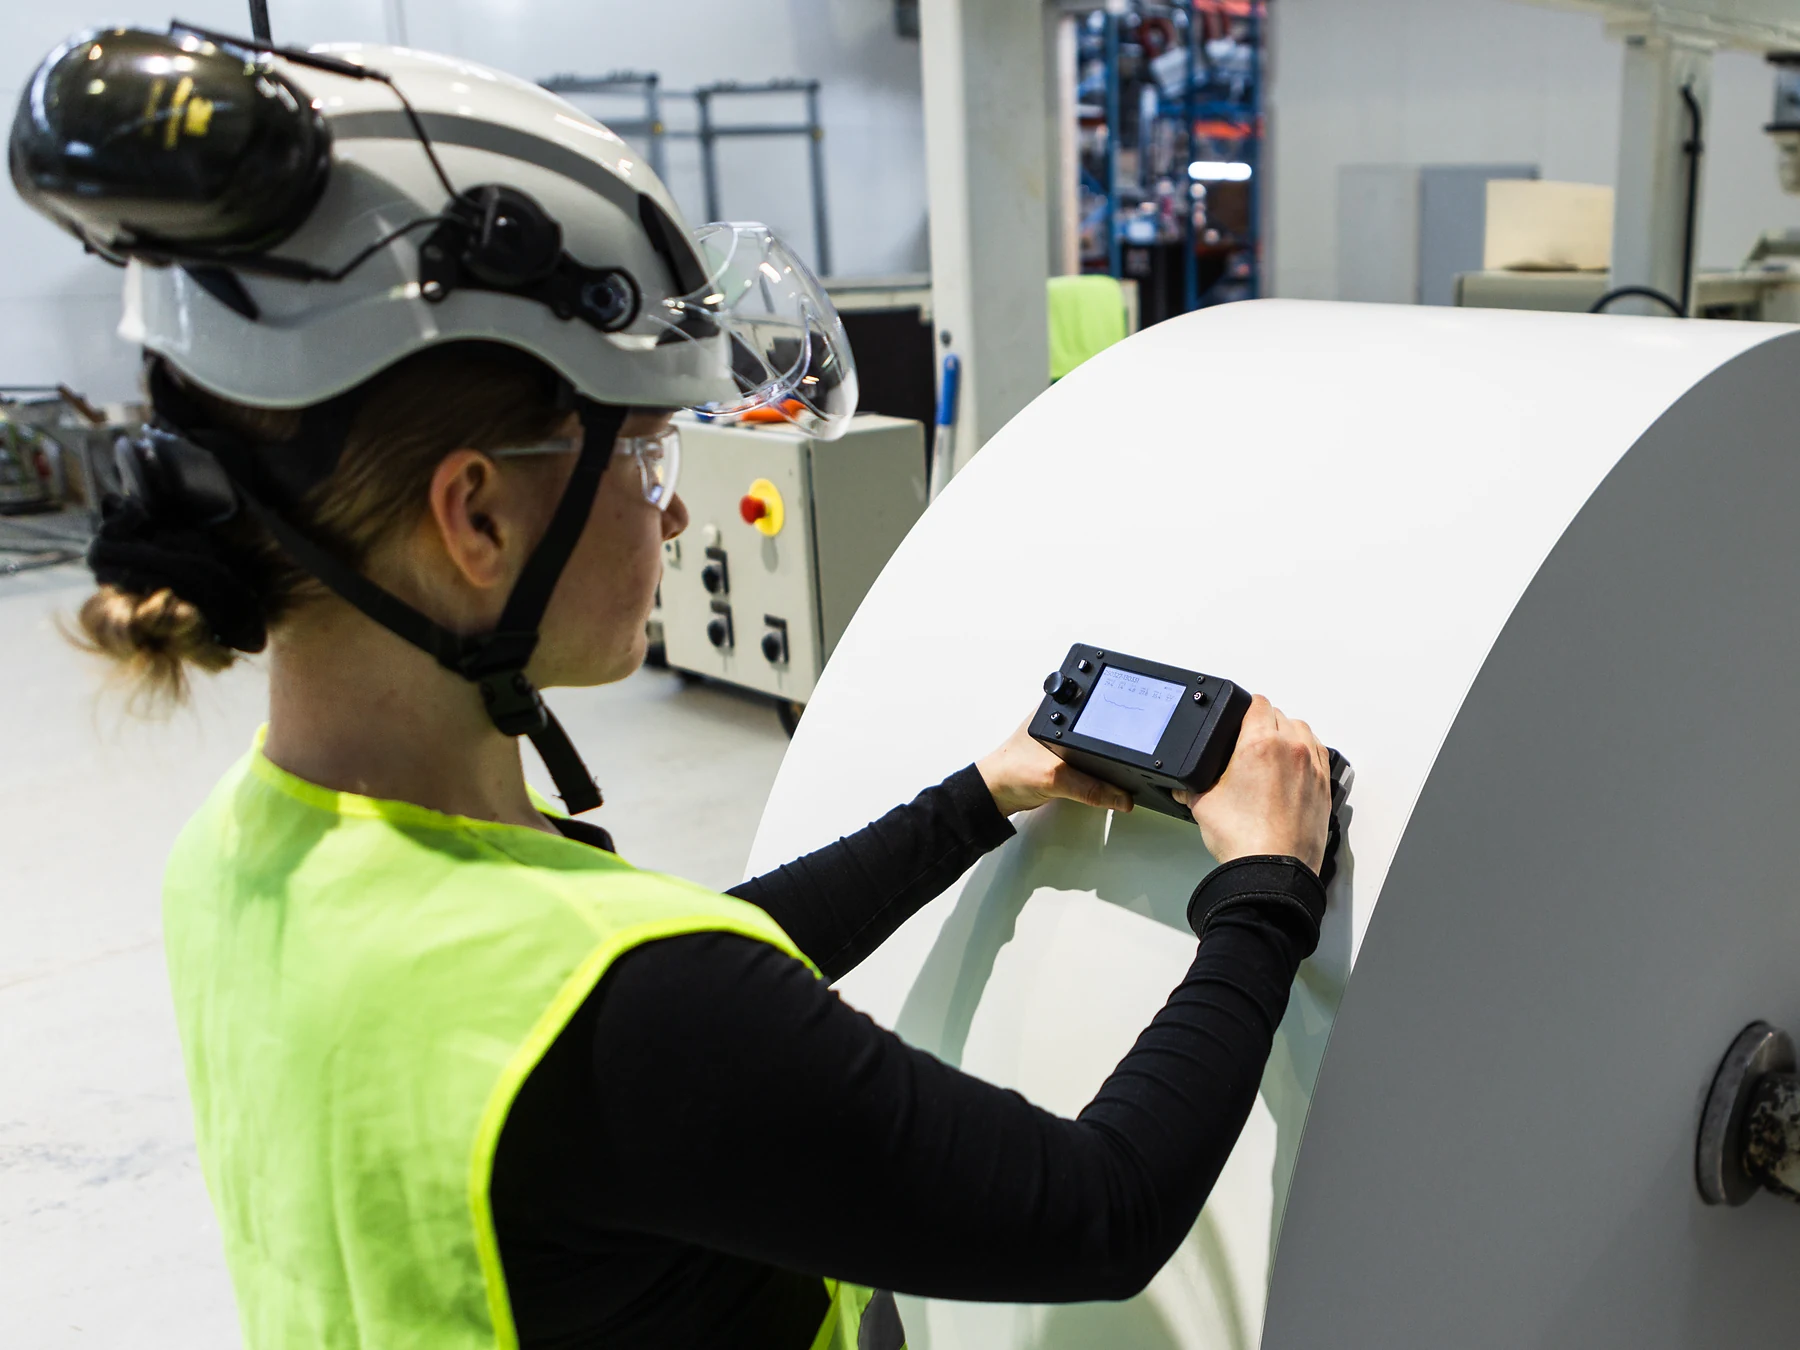
At the rewinder, the operator scans the barcode of each roll in a set and measures two or three passes per roll; the device shows the mean profile and flags any statistic outside the limits. When the device is next connected, RollView syncs the folders, writes an Excel file and a plot image for each roll, and shows the whole set in continuous mode. Over the following weeks the trend view shows whether CV% at the edge positions is creeping up, and a custom postprocessor can send the same numbers to the mill's quality database.
Tapio Analysis
Open-source software for analyzing paper and board quality variation measured with Tapio Analyzers. Tapio Analysis service customers can use it too, with the measurement data we deliver. (The analyzer itself is run by a separate program, Tapio Measurement, which comes with the instrument.)
| Tapio Analysis | |
|---|---|
| Used with | Tapio Analyzers and Tapio Analysis service data; other profile data through custom loaders |
| Version | 1.4.0 (September 2026); the download page always has the latest release |
| Release notes, file size and checksums | On the download page, for every release |
| Runs on | Windows (single program file, no installation) |
| License | Free and open source (GPL v3) |
| Documentation | Manual included with the software; support from info@tapiotechnologies.com |
What Tapio Analysis does
MD profile
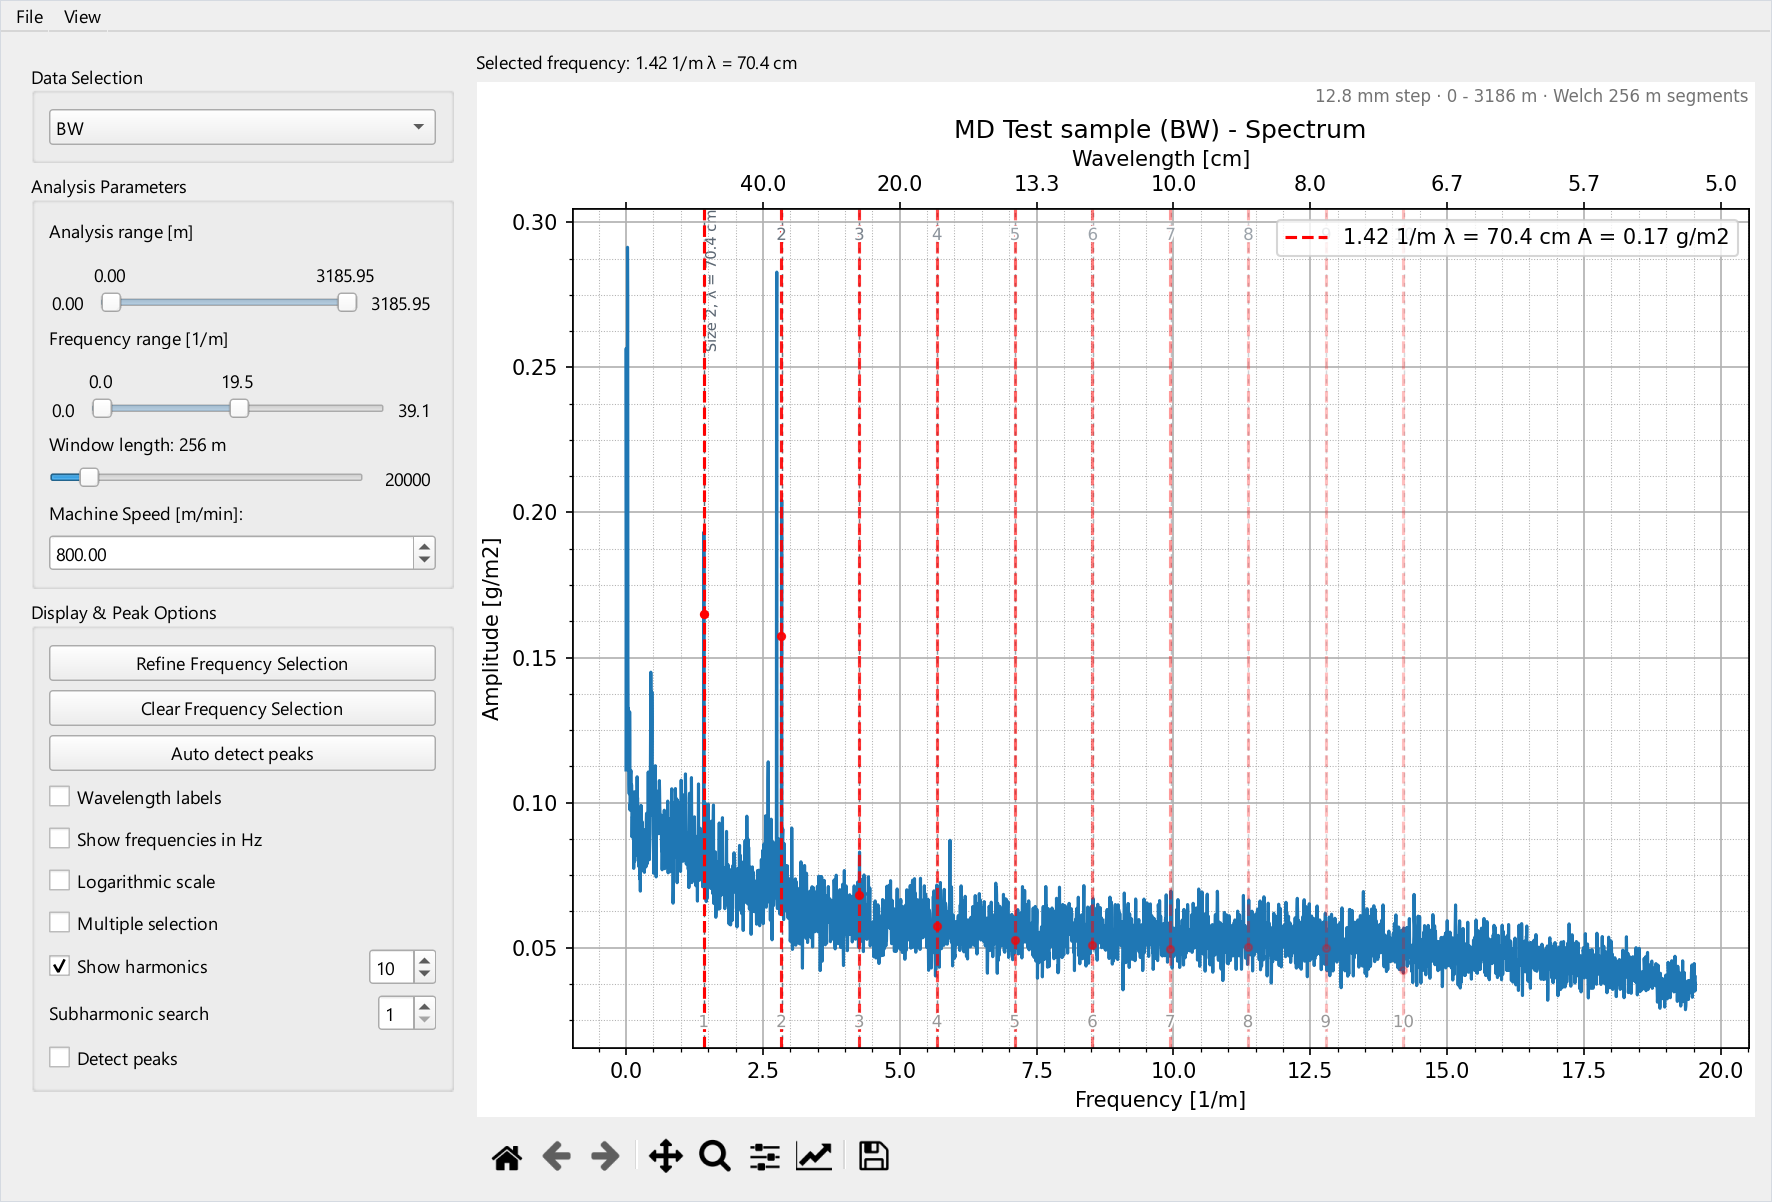
Profiles along the machine direction at any scale, with band-pass filters and statistics.
Spectrum and spectrogram
The wavelengths and frequencies of the variation, and whether they hold steady along the sample. Spectral comparison stacks the spectra of several channels.
Machine element matching
Load a paper machine file with roll diameters, fabric lengths and pump speeds, and every element's frequency and harmonics are drawn over the spectrum.
CD profile
True CD profiles from CD strips, with the mean profile, its confidence band and a waterfall of every strip. Scanner profiles from Excel can be laid over them.
CD spectrum
Periodic CD variation, marked against actuator spacings and other CD elements.
Formation and flocs
The formation index along the sample or across the width, and the floc size distribution.
Coherence and correlation
Which frequencies two channels share, and how all channels correlate with each other, in MD and in CD.
Variance component analysis
Splits CD strip data into MD, CD and residual variation.
Reports and export
MD and CD reports as editable Word documents; every plot as an image and every result table to Excel or CSV.
PapEye applications
PapEye Print Uniformity, PapEye Line Quality and PapEye Dirt Count are licensed software, each a permanent license for one PC. They are not downloads on this page: ask us for a demo or a quote, and licensed customers receive the program and a license file.
How the software is used


Need a custom loader, report or export?
We customize Tapio software: automatic reporting, exports to mill data systems and analysis features for Tapio or external data. Email info@tapiotechnologies.com or send us a message.