

Article
Using Hardness Variation (CV%) to Identify Defective Rolls

“Papermaking would be easy, if only there were no edges!”
Problem: Converter rejects were traced back to certain rolls, but the mill had no reliable way to identify them before shipment.
Task: Find a way to identify the rolls that do not meet the converter's specifications before they are delivered to the customer.
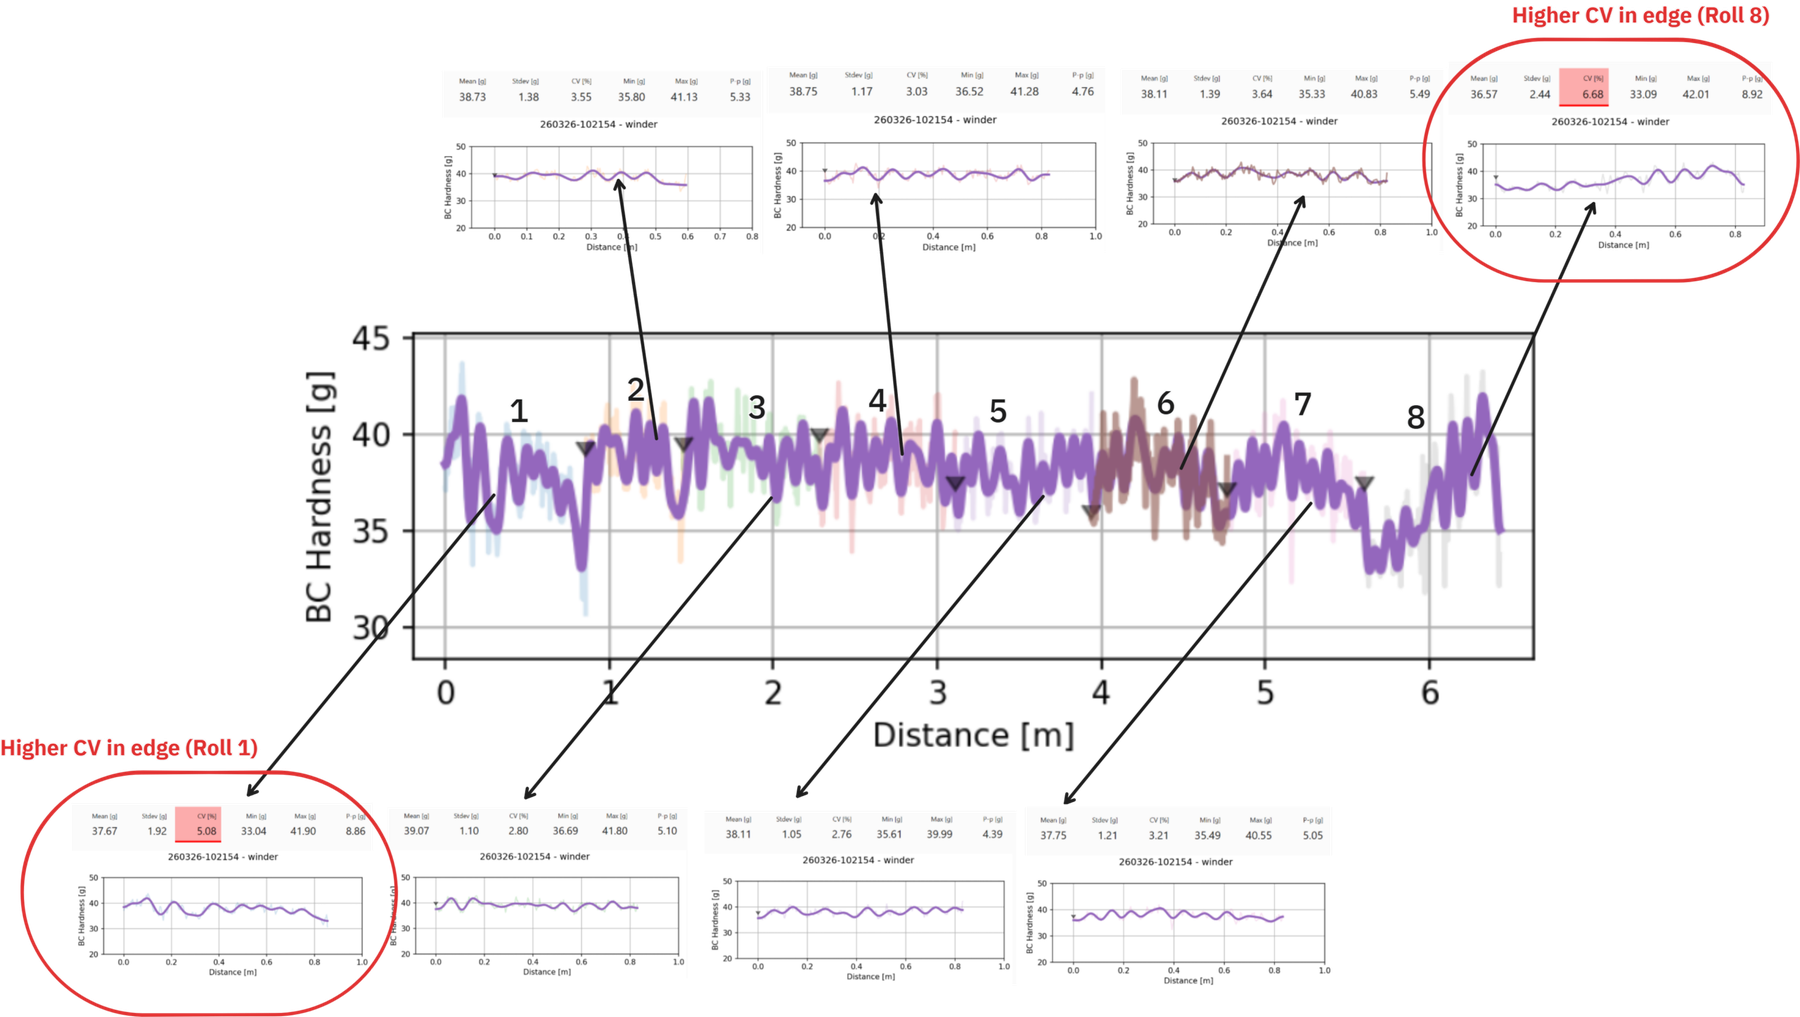
Analysis: A study was conducted at the rewinder by measuring Tapio RQP Live continuous hardness profiles of each customer roll. The hardness profiles and their key values clearly showed that the edge rolls had higher hardness variation than the rest of the rolls in each set. The result matched the issues at the customer site. High CV% (coefficient of variation) values gave the best match to the rejected rolls, whereas the mean hardness was practically identical for all rolls and therefore correlated only weakly.
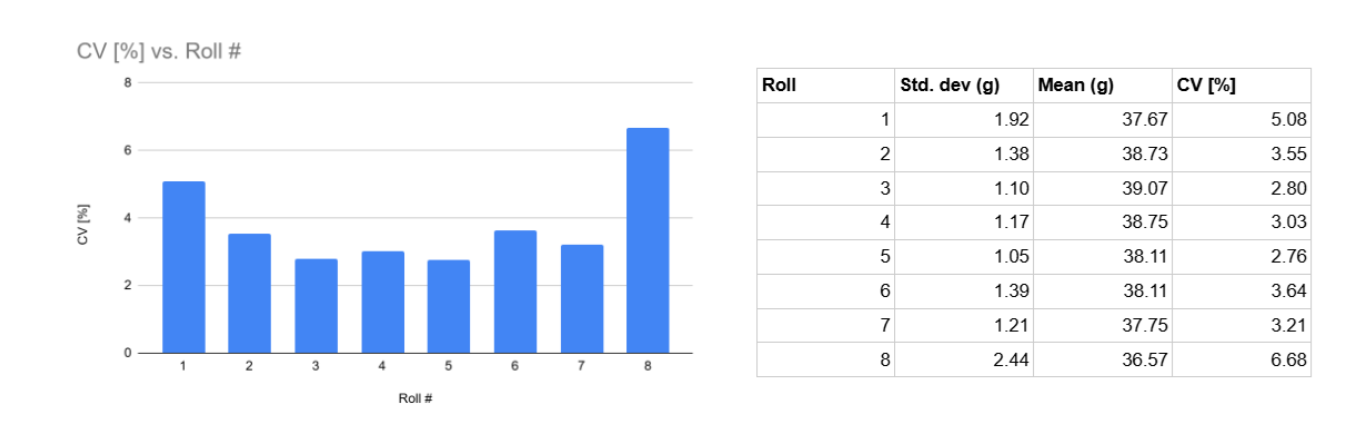
Key finding: Average hardness did not differentiate good and bad rolls. However, the coefficient of variation (CV%) clearly separated problematic edge rolls from acceptable ones. Based on previous experience with rejected rolls, the alert limit for the coefficient of variation (CV%) was set to 5 %.
Investigation of a set of reels produced by a winder-cutter
A set of reels was measured with the Tapio RQP Live hardness tester and the continuous mode in Tapio RollView was used to investigate the entire set from a winder. The results show that the edge rolls have higher hardness variation.
What is the Coefficient of Variation (CV %)?
CV% describes how much the hardness varies within a roll. It is calculated as standard deviation divided by mean hardness. A higher CV% means more variation and typically poorer roll quality.
RQP Live and Tapio RollView both calculate several statistics of the roll hardness profile. All statistics are calculated from the full profile (the mean profile when several passes are measured). (More information: Roll Hardness Profiles – What Can the Statistics Tell Us?)
Conclusion
The key values of a continuous roll hardness profile can be used to separate good rolls from bad ones. In this study, CV% was a good indicator of roll quality for the mill in question: rolls with a CV below 5 % were good to go, whereas rolls above 5 % were likely to cause issues in further processing.
Benefits of Tapio RQP Live
Continuous hardness profiles show the inner structure of the roll in a way that single-point hardness measurements cannot. Benefits of using RQP Live include:
- Identification of rolls outside acceptance limits before shipment
- Objective quality criteria at the rewinder and at other suitable stages of production
Measure your own rolls with RQP Live
See continuous roll hardness profiling, live pass/fail results and Tapio RollView analysis on a remote demo.