

Tapio RQP Live
RQP Live tutorial
Six short videos, from switching the device on and measuring your first roll to alert limits, syncing and the analysis tools in Tapio RollView.
The videos
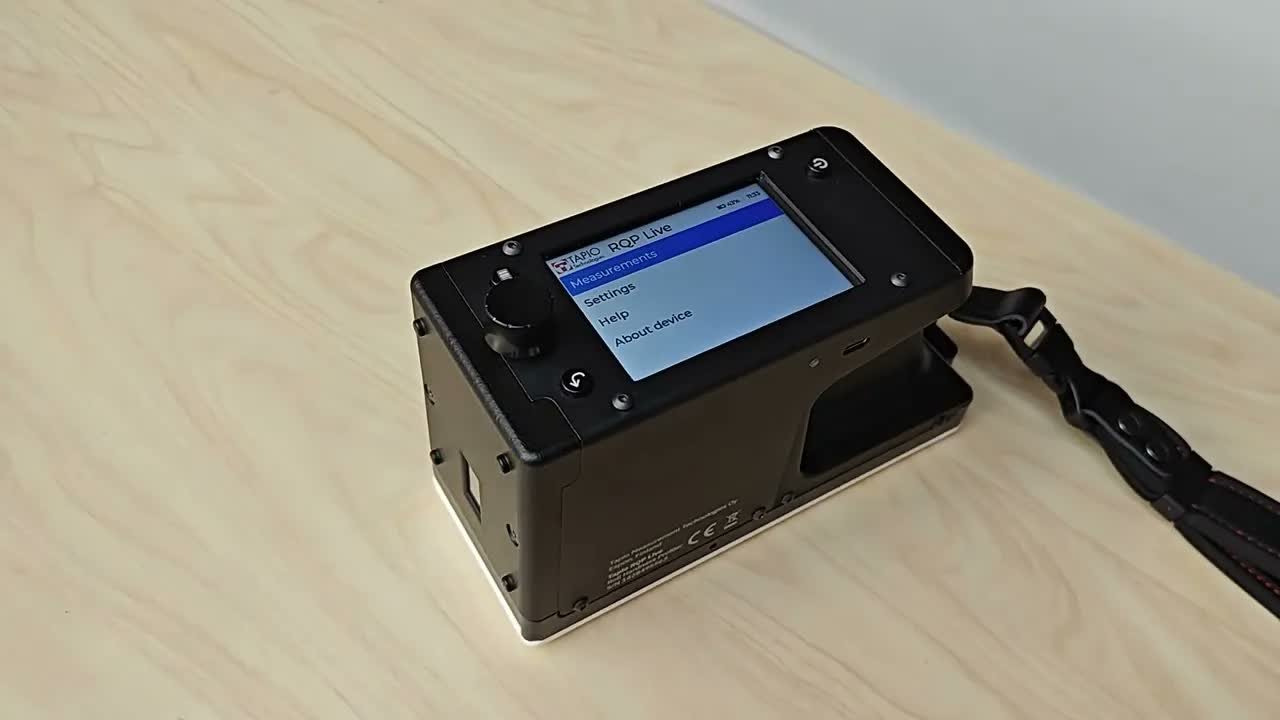
Getting started with RQP Live
The device, its controls and basic operation.
Tips
- Charge the battery over USB-C with a compatible Power Delivery charger. The charge level is always shown on the display.
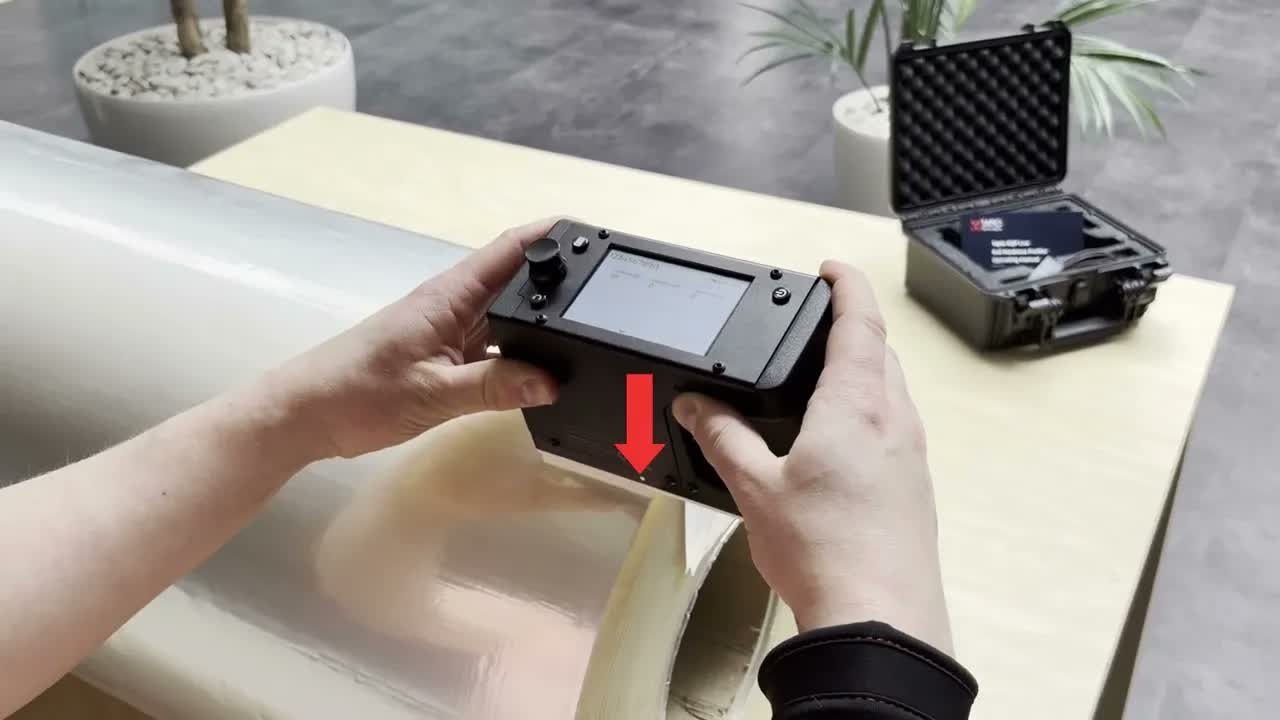
Measuring roll hardness profiles with Tapio RQP Live
Switch on the device, create or select a folder, measure a profile and view the results, with the measurement technique that gives repeatable profiles.
Tips for accurate measurements
- Hold the device still until the hammer impacts are steady, then start moving.
- Keep the whole bottom of the device on the roll, without tilting it.
- Push at a steady speed, as shown in the video. The speed bar on the display turns red if you go too fast.
- Stop at the end of the roll before lifting the device. By default it removes the last 12 impacts, recorded while you stop, from the profile.
- Measure two or three profiles into each folder. The passes show the repeatability, and their mean gives more reliable statistics.
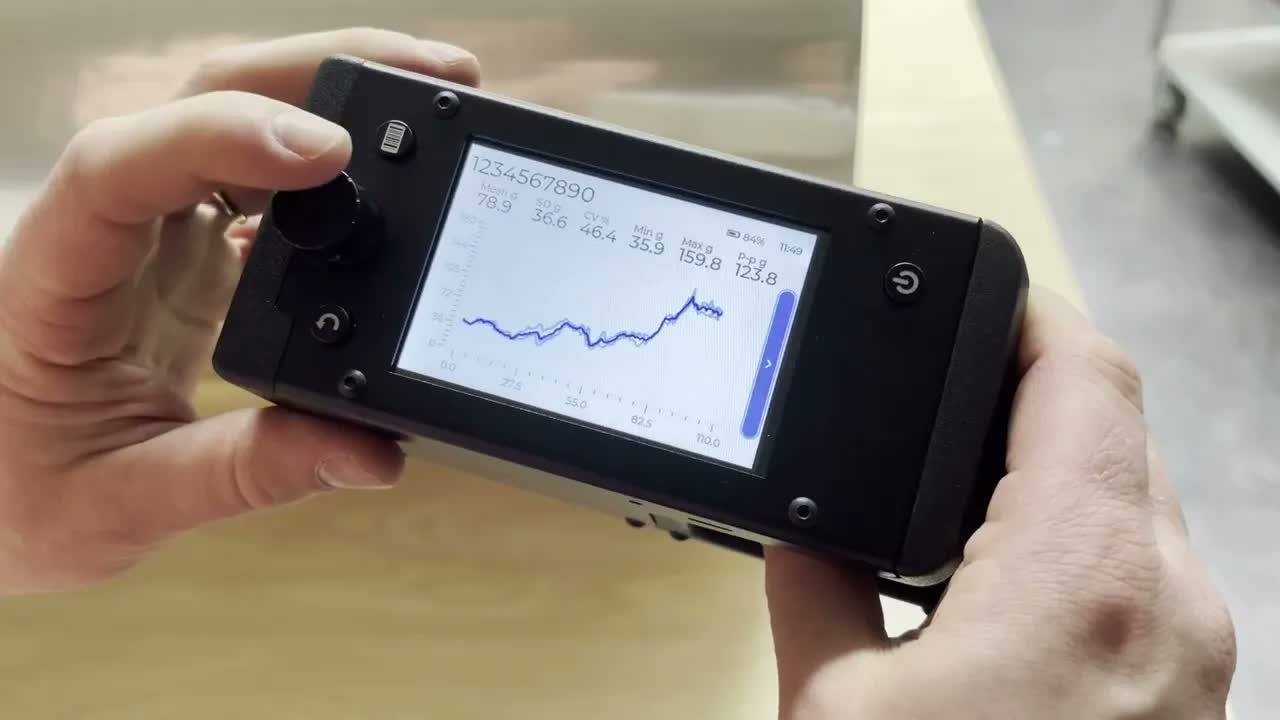
Working with profiles and folders
Select profiles, view the results and manage folders on the device.
Tips
- With the Quick measure setting on, the device creates a folder automatically when you press it onto a roll.
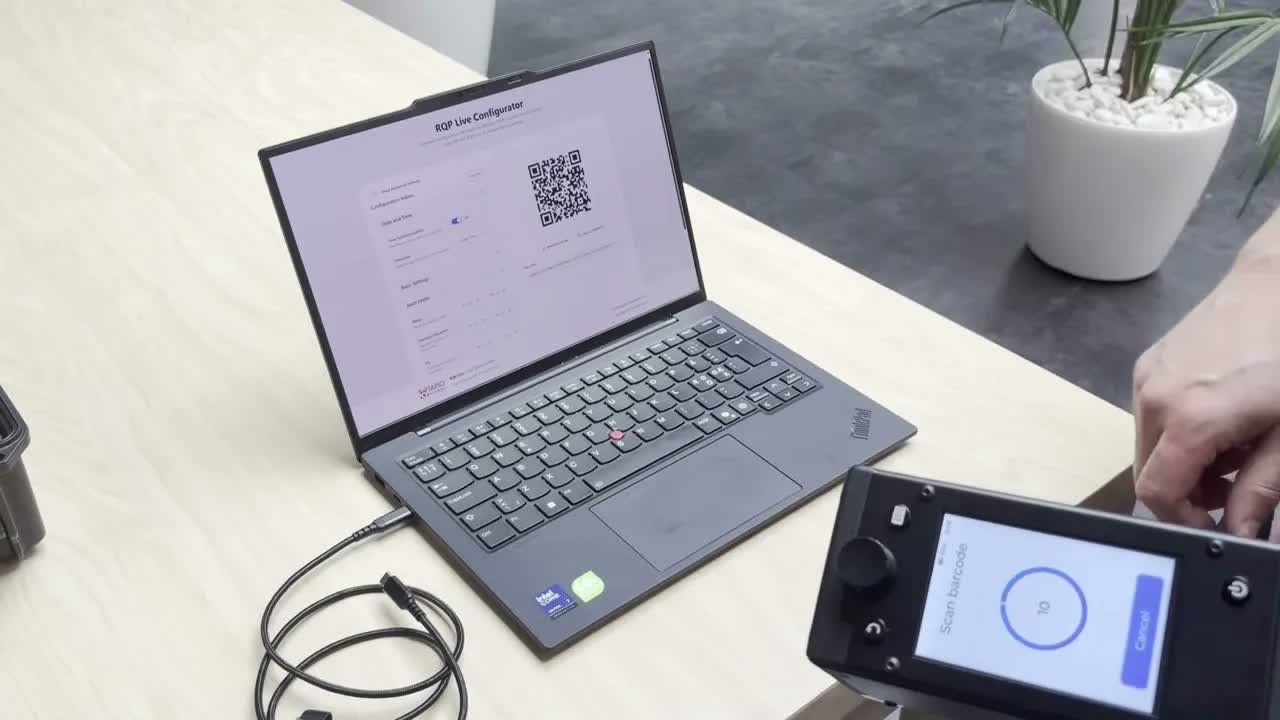
Setting alert limits and device settings
Set alert limits and other device settings from the device menu, or with a QR code made in the RQP Live Configurator.
Tips
- The device clock can also be set with the RQP Live Configurator.
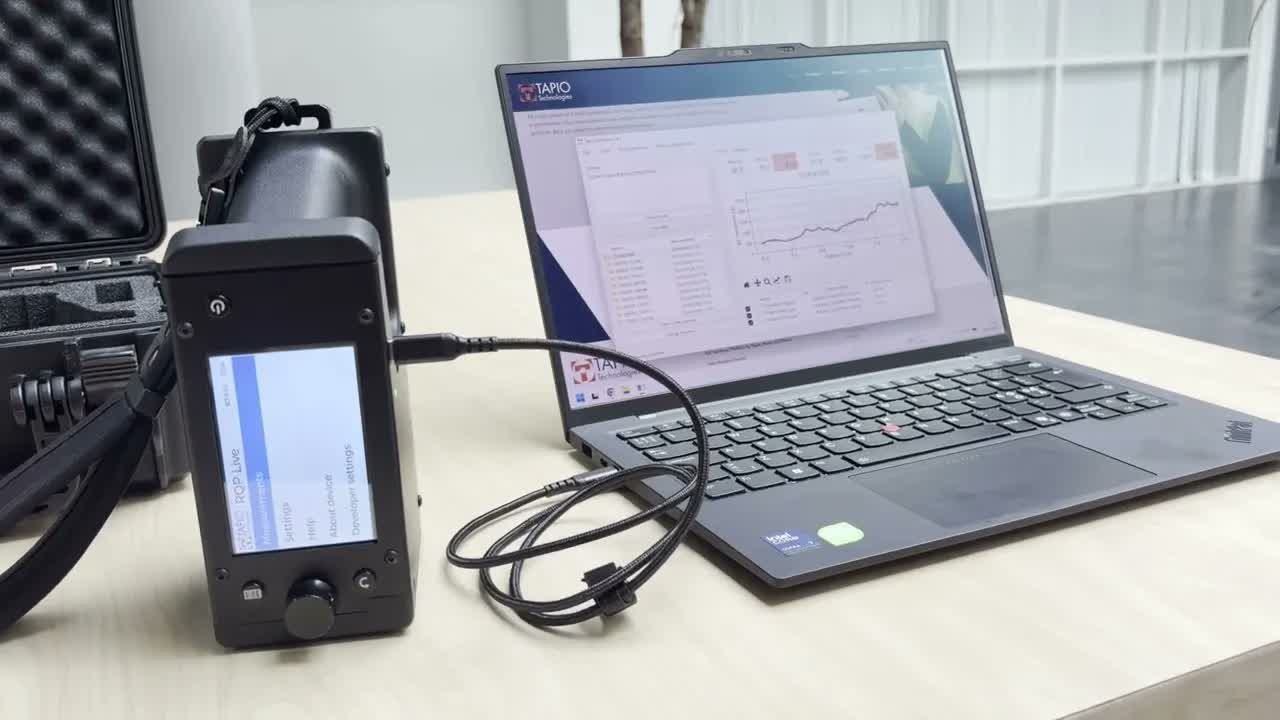
Transferring data to PC with RollView
Transfer the measurements to your PC and look at them in Tapio RollView, which is free to download.
Tips
- A sync copies the folders and profiles to the PC and then removes them from the device, apart from the number of newest folders you set the device to keep.
- RollView sets the device clock from the PC clock when it connects.
- The standard postprocessors write Excel and image files, and JSON if you enable it. Custom postprocessors can write the profiles in any format and send them anywhere.
- The Advanced settings hold the analysis tools: filtering, the spectrum, exclude regions and highlight zones.
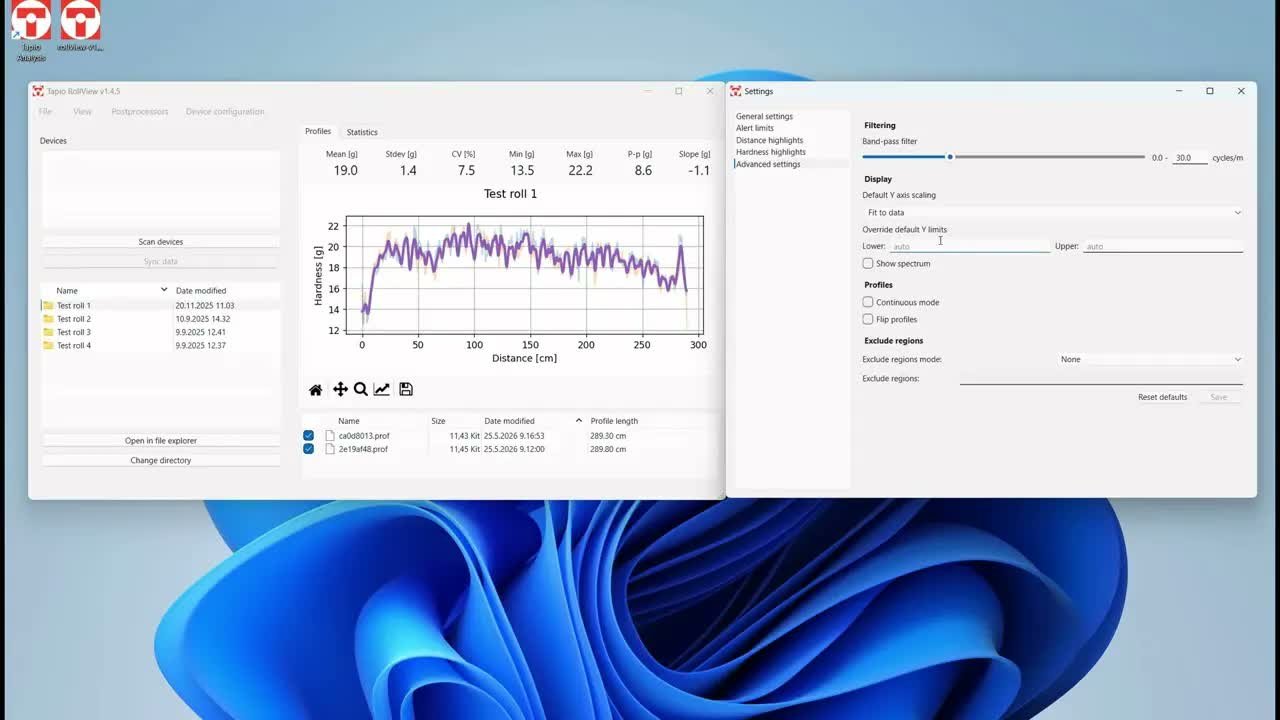
Advanced analysis features and settings in Tapio RollView
Exclude regions, highlight zones, Y-axis limits, the band-pass filter, the spectrum, continuous mode, custom postprocessors, and saving and loading settings.
Key steps
- Open Settings and go to the Advanced page. Its three sections are Filtering, Display and Profiles; every change is applied when you press Save.
- Exclude regions: choose Relative (% of the roll width) or Absolute (metres) and enter the ranges to leave out, such as the roll ends. Excluded regions are shaded in the chart and left out of the statistics.
- Highlight zones: on the Distance highlights and Hardness highlights pages, add a shaded range along the roll or a hardness band around the mean, fixed or relative, to mark the zone you watch.
- Y-axis limits: the default scaling is Start at zero or Fit to data; tick Override default Y limits and enter a lower and an upper value to keep every roll on the same scale.
- Band-pass filter: set the wavelength range to keep, in cycles per metre, to smooth the profile and show the trend; the statistics follow the filtered profile.
- Show spectrum draws the spectrum of the mean profile under the chart, so a periodic variation can be read as a wavelength and matched to the machine.
- Continuous mode stacks the profiles of a folder end to end, which is how a whole winder set is viewed as one profile.
- Custom postprocessors: the Postprocessors menu lists the standard exports (Excel, JSON, plot image) and any custom module placed in the postprocessor folder; Run postprocessors applies them to every roll folder.
- Save and load settings: File → Export settings file writes the current preferences to a JSON file, and Load settings file brings them into another RollView installation.
Glossary
- Profile
- A hardness profile measured along the roll width. A profile consists of hardness values measured at known distances.
- Folder
- A collection of profiles belonging to one roll. All profiles are stored in folders.
- Mean profile
- The average profile calculated from multiple profiles in a folder.
- Mean profile statistics
- Mean, standard deviation, CV%, minimum, maximum and peak-to-peak of the mean profile, which describe how much the profile varies.
- Hardness value
- The value at one position: the peak deceleration of the hammer as it hits the roll, in g (acceleration relative to gravity, not grams).
Questions about RQP Live?
Book a remote demo, or ask us about measurement technique, alert limits or connecting RollView to your quality system at info@tapiotechnologies.com.