

Article
Roll Hardness Profiles – What Can the Statistics Tell Us?
The quality of a roll is not about appearance: it depends both on the rolled material and on how the roll has been wound. The hardness profile provides valuable insight into roll condition and helps detect faults that are often invisible to the eye or missed by conventional methods. The traditional way of checking hardness is knocking the roll with a wooden plank or stick and listening for loose spots. This requires a skilled operator, and even then the result is only qualitative.
Unlike single-point hardness testers, Tapio RQP Live produces a continuous, position-tracked hardness profile. The device operates by gently and repeatedly tapping the roll surface with a hammer, capturing a continuous curve of hardness vs. distance. Because the tapping force is light, it does not leave harmful marks on most materials.
Why measure roll hardness?
The hardness profile is a great indicator of overall roll quality. It can reveal common faults such as:
- Loose edges
- Loose streaks
- Rope marks
- Bagginess
- Signs of an uneven thickness profile
- Signs of an uneven tension profile
- Rolls that are wound too loosely or too tightly
Detecting these issues early helps reduce production problems, avoid waste, and improve performance in the production of suitable rolled products.
Understanding the hardness profile statistics
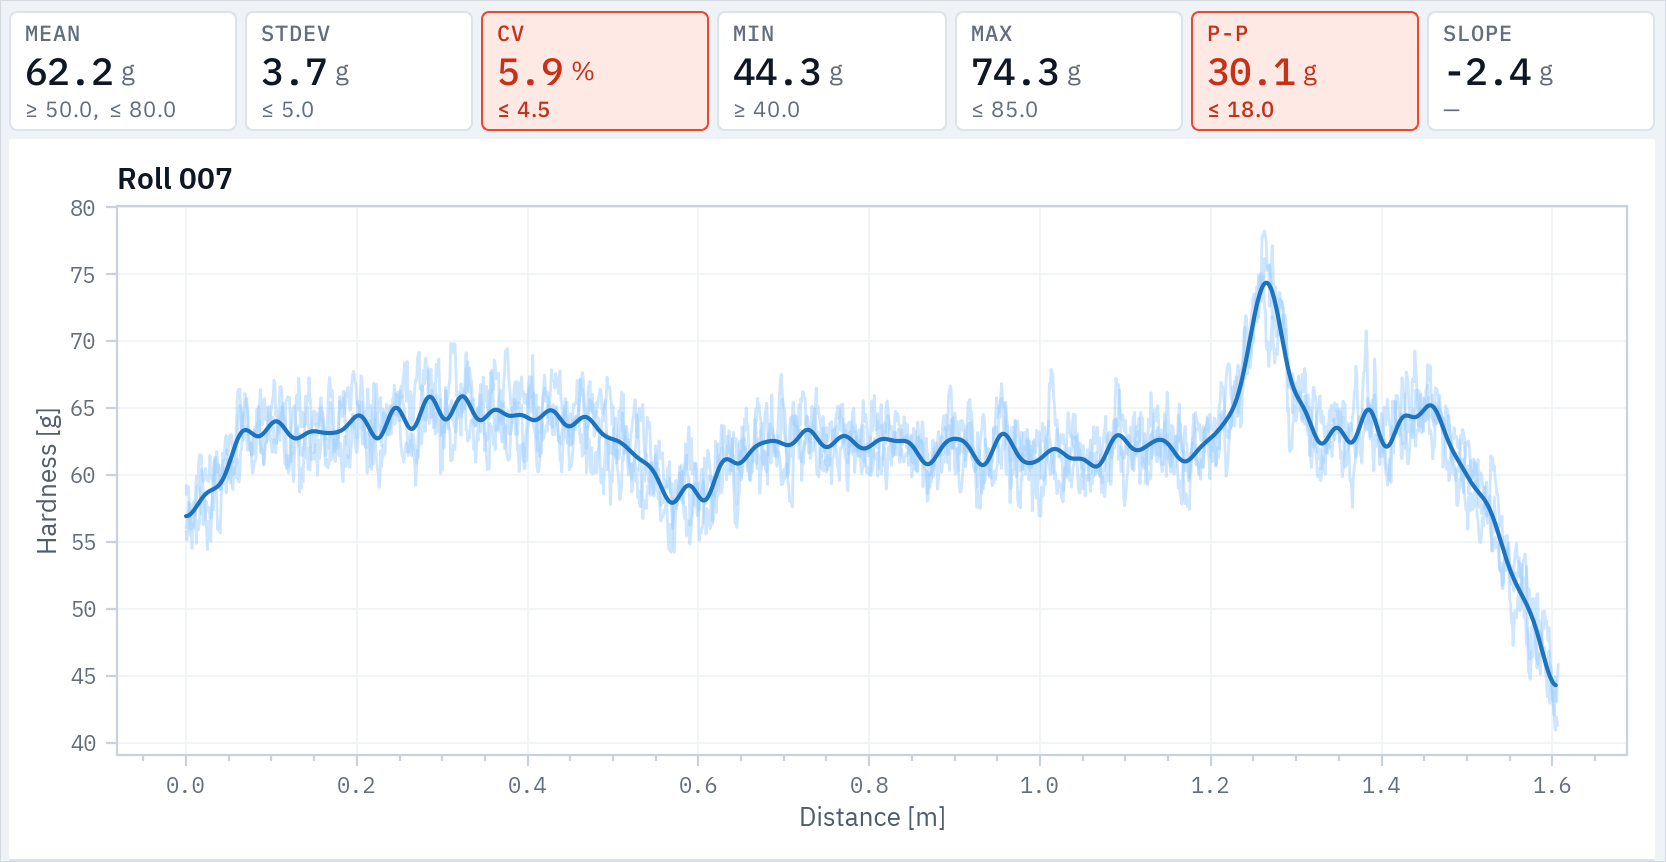
The hardness profile is displayed as a curve (the average profile, if more than one pass has been measured), showing how hardness changes across the roll width. Key statistical values are shown with the curve, making interpretation straightforward:
- Mean [g] – The average hardness of the roll (hardness in g: the hammer's peak deceleration relative to gravity, not grams).
- Stdev [g] – The standard deviation, showing how much the hardness varies.
- CV [%] – The coefficient of variation (standard deviation divided by the mean hardness). A high CV means unevenness in the roll (see how CV% identified defective rolls in a mill).
- Min [g] / Max [g] – The softest and hardest points.
- P–P [g] – Peak-to-peak difference, i.e. the range between the softest and hardest points.
These values provide a quick way to judge whether a roll is uniform or if there are significant variations.
Good vs. poor quality rolls
Ideally, the hardness profile would be a flat line. In practice, however, it is rarely possible to achieve a perfectly uniform profile. A well-formed roll will typically show a stable hardness profile with relatively low variation.
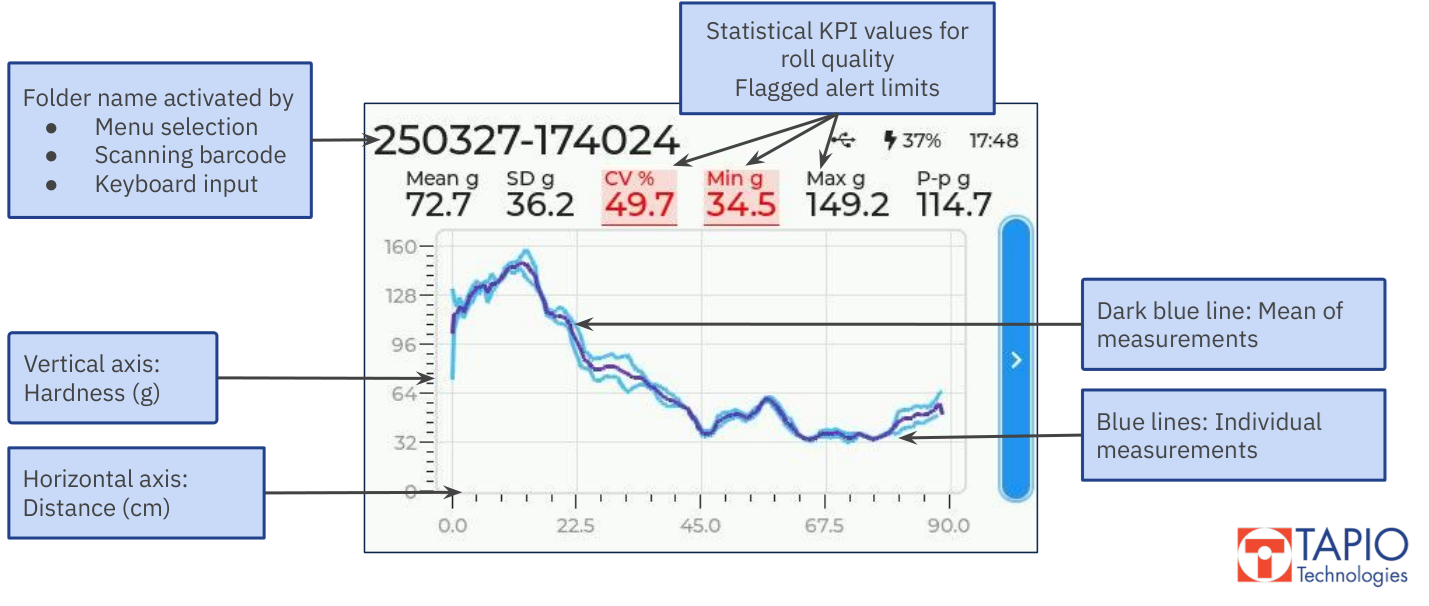
In the example below, the mean hardness was 72.7 g, but the coefficient of variation reached nearly 50%, with values ranging from as low as 34.5 g up to 149 g. The profile is clearly tilted, and later analysis found excessive thickness variations in the rolled plastic, the likely cause.
Such wide differences indicate serious issues with roll structure and can lead to significant problems during later processing. Both the RQP Live device and Tapio RollView can be configured to automatically flag problematic rolls based on their profile statistics, alerting operators when unevenness exceeds acceptable limits. The exact thresholds can be adjusted according to product requirements.
Conclusion

The hardness profile is a practical tool for monitoring roll quality. By combining the visual profile with statistical indicators, operators can quickly spot faults, compare rolls, and make better decisions about accepting or rejecting rolls. Tapio RQP Live makes this information available instantly, helping mills and converters spot uneven rolls before they cause costly problems.
Measure your own rolls with RQP Live
See continuous roll hardness profiling, live pass/fail results and Tapio RollView analysis on a remote demo.