

Article
Optimizing paper and board machine CD profiles with Tapio Analysis
In modern paper production, achieving an efficient and accurate cross-direction (CD) profile is critical for product quality and production cost control. In typical production lines, online scanners provide the operators with the CD profile. However, online QCS (Quality Control System) scanners have inherent limitations: a traversing scanner follows a diagonal path that mixes machine direction (MD) and CD variation, and its spot size and filtering limit fine detail, making it challenging to obtain a true, undistorted CD profile.
High-resolution Tapio CD profile measurements overcome these limitations. Tapio measurements provide true CD profiles from actual CD strips without any MD distortion. Samples are recorded at sub-millimeter intervals and the sensor channels are aligned to the same positions in the paper, allowing for detailed correlation studies as well as, depending on the sensor aperture, the investigation of formation-level phenomena. In addition, Tapio profiles extend all the way to the very edges of the produced paper sheet, a region where QCS scanners often have limited visibility.
With the Tapio Analysis service, mills can easily optimize CD profiles by identifying inefficiencies and localized profile defects. The accurate measurements can also be used for tuning and calibration of QCS scanners, supporting checks of scanner alignment and actuator response.
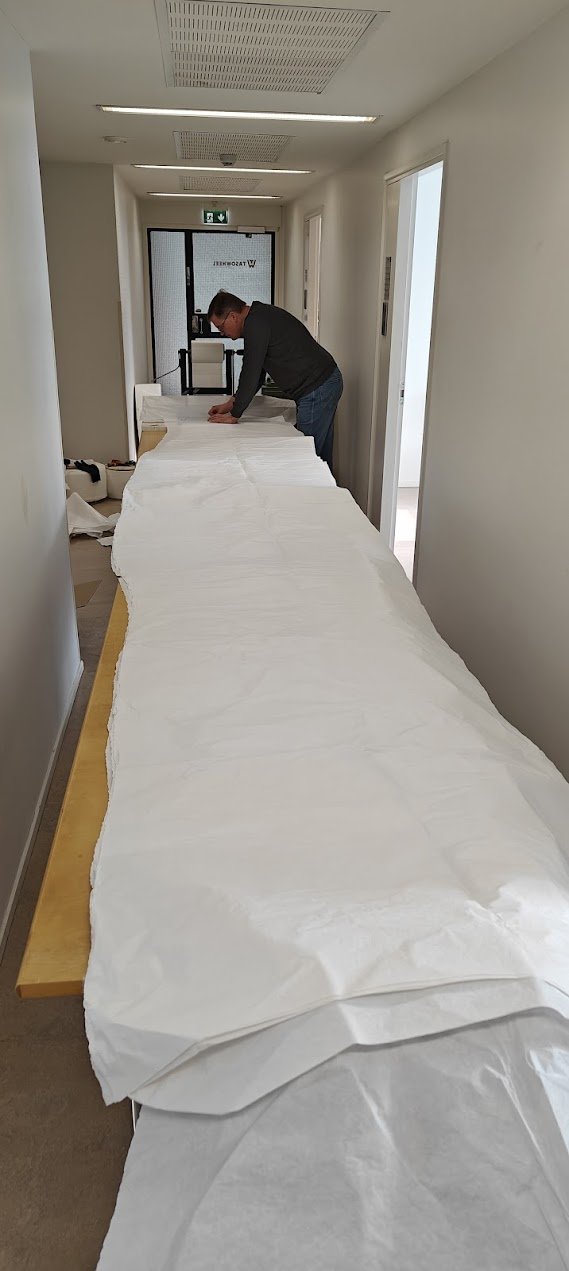
Figure: Tapio Measurement Technologies provides high-resolution CD measurement services from customer-supplied CD strips. Multiple full-width strips from the parent reel are needed for a complete analysis (see the sample preparation instructions). At Tapio’s laboratory, the strips are carefully prepared into a sample roll, enabling full high-resolution scanning with a Tapio Analyzer. Results are provided as a report with an online meeting with Tapio experts to discuss the results.
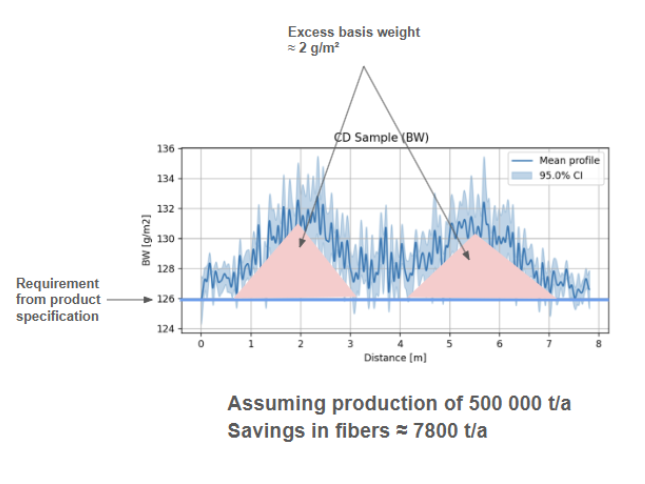
Figure: Excess grams in basis weight profiles accumulate into large amounts of unnecessary fiber costs. In this example, small but persistent excesses in basis weight across the CD direction result in significant material overuse. The savings figure is an illustrative calculation assuming 500 000 t/a production, not a measured saving. Even a few grams per square meter, when scaled to full production volumes, can lead to substantial unnecessary fiber costs. High-resolution Tapio profiles help mills detect and correct these inefficiencies, supporting better cost control and sustainability goals.
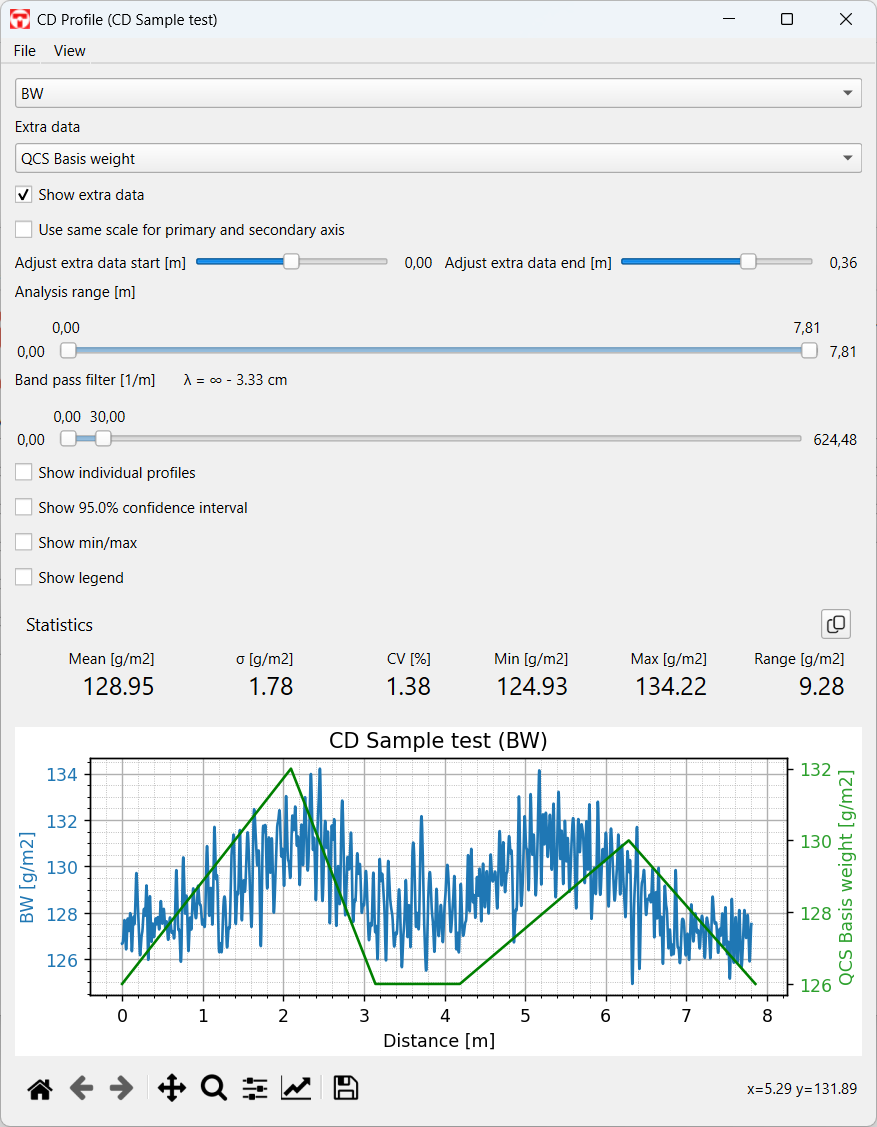
Figure: The open-source Tapio Analysis software allows the user to easily compare high-resolution Tapio CD profiles with provided QCS or other external data. Overlaying Tapio’s undistorted, high-resolution measurements with QCS data reveals discrepancies that may not be visible using online scanners alone.
Key benefits of Tapio CD measurement and analysis
What is needed
Please send us multiple full-width CD strips from a parent reel, prepared as described in the sample preparation instructions. We accept hand-cut strips as well as strips from standard sample cutters.
Possibilities of Tapio CD Analysis
- Measurement of true CD profiles without MD distortion for basis weight, caliper, ash content, gloss and transmission (depending on configuration), plus derived density and bulk.
- Correlation analysis between multiple paper properties.
- Full sheet width coverage, including critical edge regions
- Detection of inefficiencies and opportunities for material savings
- Profile comparisons with QCS scanner or other provided external data
What you get
- Measurement report detailing the findings
- Raw measurement data files, which can be analyzed using the free Tapio Analysis software
- Online meeting with the Tapio team to discuss the findings
Send us your samples
Send us MD rolls or CD strips. You get the measured profiles, a report of the findings and a review with a Tapio specialist.