

Article
Hidden defects in rolls: a closer look with Tapio RQP Live
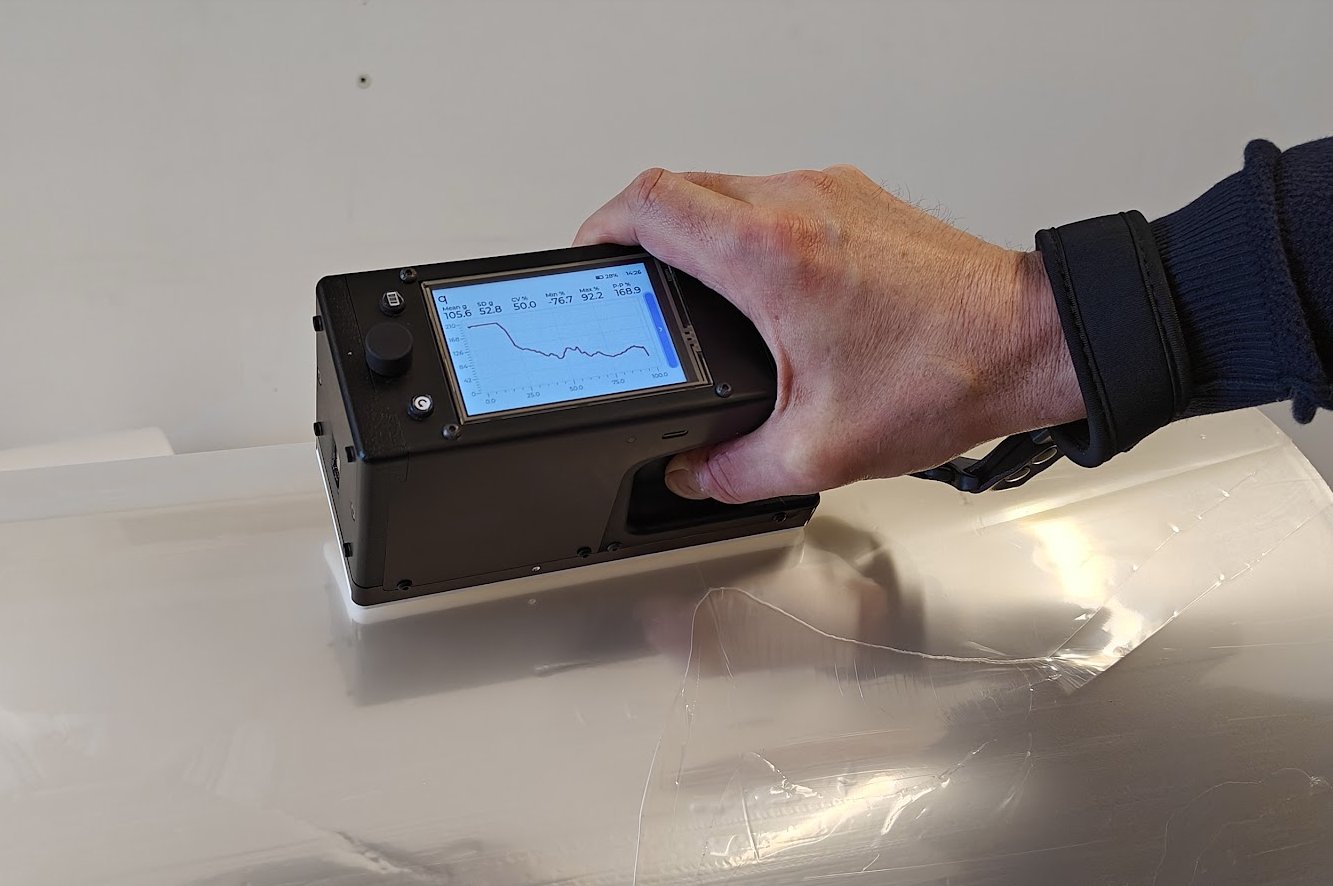
A paper, board or plastic roll may appear perfectly fine on the outside. The surface layers may seem to be uniform, smooth, and free of any obvious defects. However, beneath the outer layers, hidden issues can exist that compromise the performance and quality of the product: issues that are not immediately visible but can cause serious problems later in the process.
At Tapio Measurement Technologies, we have encountered several cases where a detailed hardness profile has revealed otherwise undetected quality problems inside the roll. In this article, we present three such cases where hardness profiling was critical in identifying and addressing the issues before they escalated.
In many instances, such quality defects are not spread throughout the entire production, but are instead localized to specific sections of the roll or certain parts of the production line. For example, a loose edge or streak running through the sheet can cause significant problems later in the production and converting.
Because the defects are often confined to a specific area, such as a single edge or a localized band across the width, Tapio RQP Live can also be used to pick out the problematic rolls even from a large batch of produced rolls.
Why does it matter?
As industry demands grow, manufacturers must adopt smarter quality control methods. Relying on outdated testing techniques increases the risk of production failures. Investing in easy-to-use measurement technology helps identify rolls outside your acceptance limits – before they leave your facility.
Want to learn more about the impact of roll hardness on production efficiency and quality control? Read Hidden roll defects are costing you more than you think.
Use Case 1: Hardness variation consistent with uneven tension in plastic film rolls
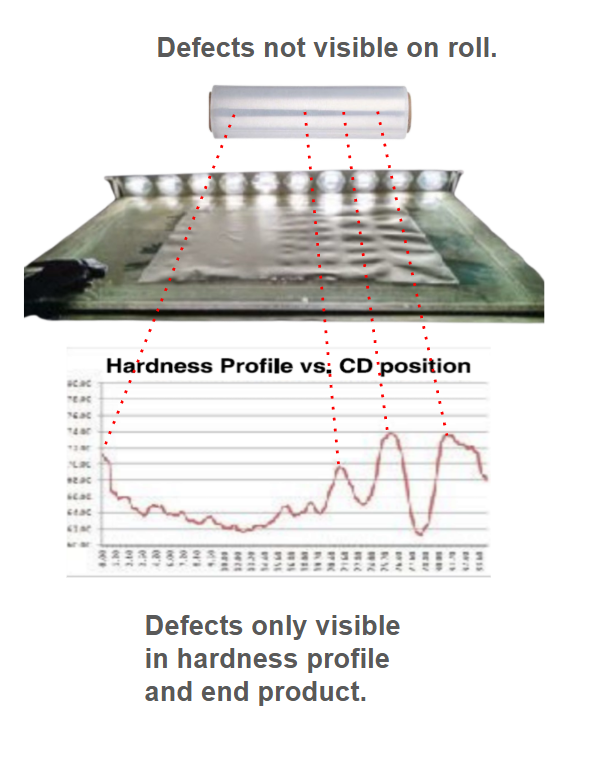
The below image highlights a case where a plastic roll was initially inspected and no surface defects were observed. However, when the roll was unwound, baggy and deformed areas in the film became clearly visible, consistent with uneven winding tension causing localized stretching. Such deformation would have been difficult to detect without further testing.
The regions where the film appears baggy or loose are typically found in the same areas that show significant deviations in the roll hardness profile. Variations in the hardness profile indicate uneven winding, often caused by inconsistent web tension, thickness variations or other process-related reasons.
Such variations may not be noticeable when visually inspecting the roll surface, but they manifest clearly when unwinding and analyzing the film. This is why hardness profile measurements are critical: they reveal hidden structural inconsistencies that can lead to product failure or poor performance in the end use.
Use Case 2: Correlation between thickness variation and hardness profile in PE plastic film roll
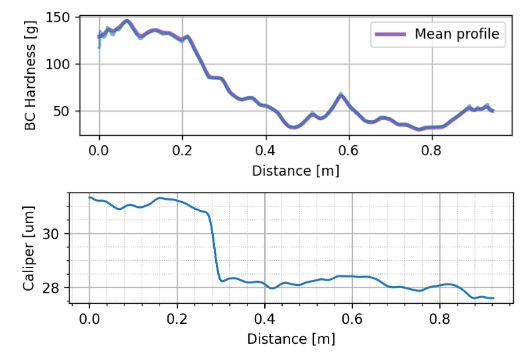
The below figure shows the measured hardness profile (top) and thickness (caliper) profile (bottom) from a polyethylene (PE) plastic film roll. The measurements reveal a strong correlation between the roll’s hardness and its thickness across the cross direction (CD) of the roll. Areas where the film thickness decreases also show a corresponding drop in hardness. This indicates that variations in film thickness during production can have a direct impact on the mechanical properties and winding quality of the roll.
By using Tapio RQP Live for regular roll hardness measurements, manufacturers can detect hardness variations early; where hardness follows film thickness, as here, the thickness profile and related production parameters become candidates to check. Monitoring both hardness and thickness together provides a more complete picture of roll quality and helps in taking corrective actions where necessary.
Use Case 3: Bagginess caused by paper web tension profile in edge rolls
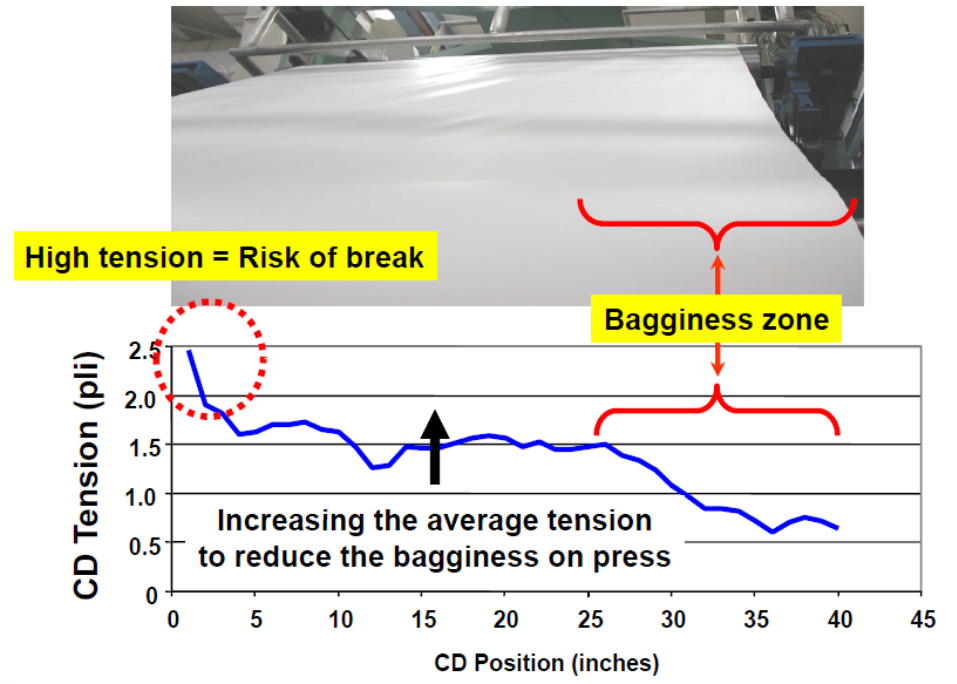
In paper production, machine rolls typically exhibit softer edges compared to the middle areas of the roll. While some degree of softness at the edges is normal and expected, it is important to understand the limits: how much hardness variation the converting process can actually tolerate without causing downstream problems.
Continuous, position-tracked hardness profiles measured with Tapio RQP Live show the position and severity of the soft edges. With these profiles, operators are able to:
- Locate where the hardness drops below acceptable levels.
- Define a precise, tolerable edge width for cutting based on real hardness data.
- Adjust machine settings to better control the caliper profile and minimize the problematic effects at the edges.
Measure your own rolls with RQP Live
See continuous roll hardness profiling, live pass/fail results and Tapio RollView analysis on a remote demo.