

Article
Comparing paper quality variation between machines and suppliers
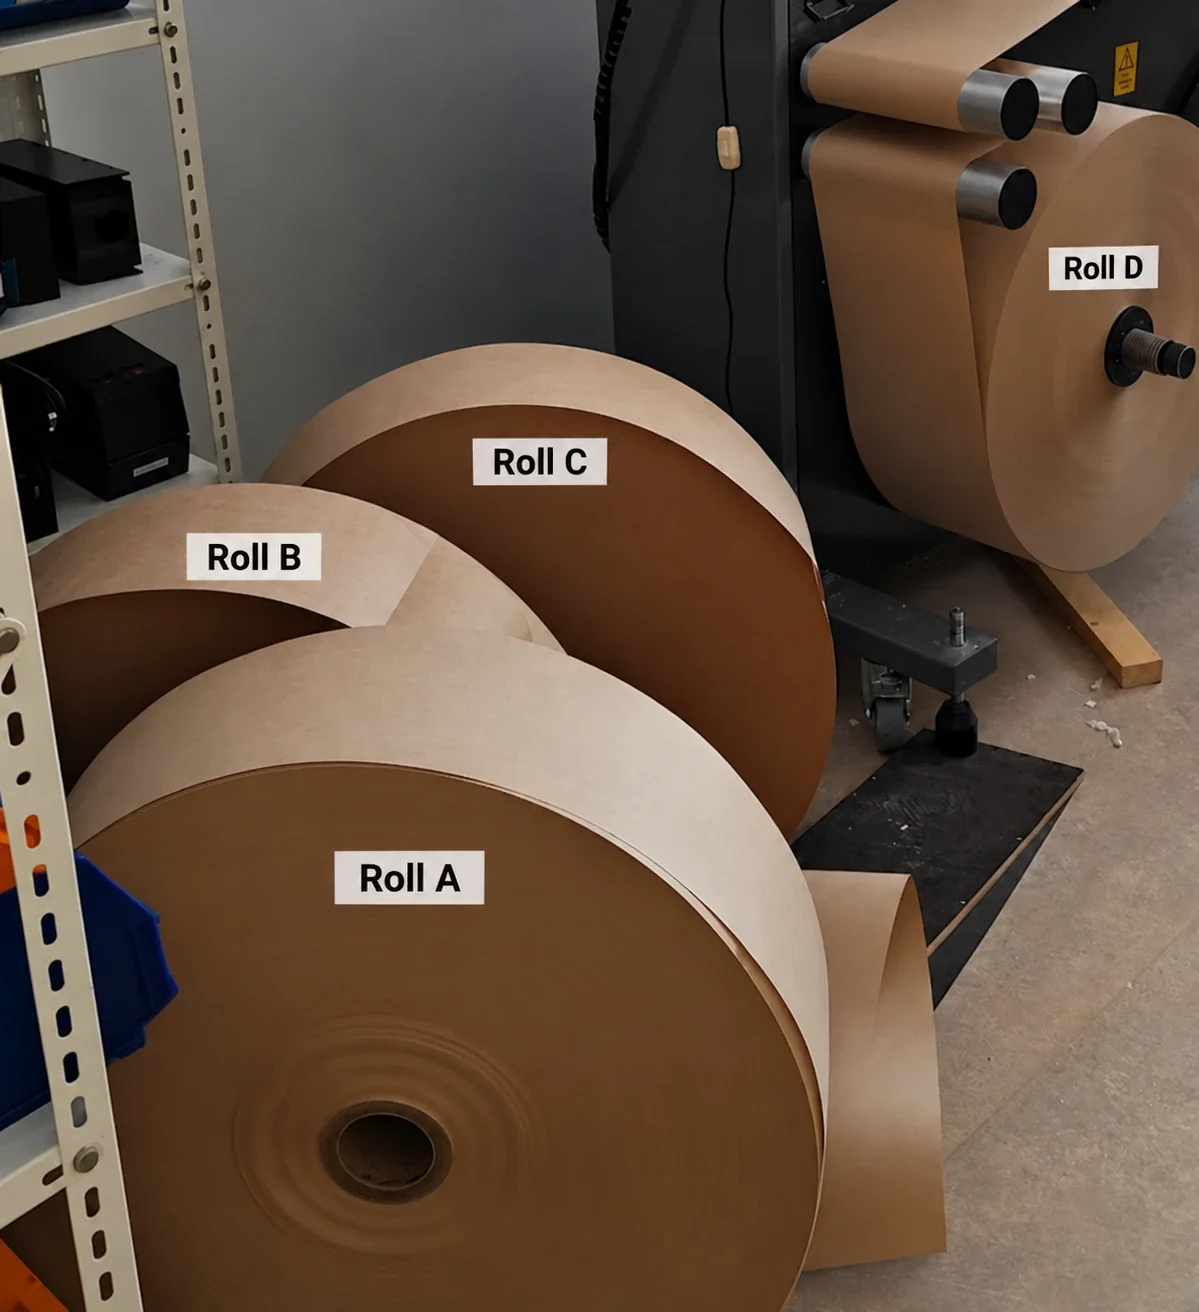
Different paper grades can have nearly identical average properties but differ considerably in their uniformity. Such differences can affect printing, converting and other downstream processes.
Tapio Analyzer measurements can be used to compare the variation of basis weight, caliper, ash, gloss and other properties between paper grades, suppliers or production machines. We can also compare the results with historical measurements in our archive to see how much a particular sample differs from previously measured papers.
This article presents an example using machine-direction (MD) measurements from four different paper machines.
Comparing four paper machines
The example consists of four uncoated paper grades with basis weights between 60 and 75 g/m², each from a different paper machine. All samples were measured with a Tapio Analyzer, and the first 3,100 metres of each measurement were used for the comparison. The measurements are presented anonymously as Machines A–D.
The variation of each paper property is expressed as a coefficient of variation (CV), which is the standard deviation divided by the mean value, expressed as a percentage.
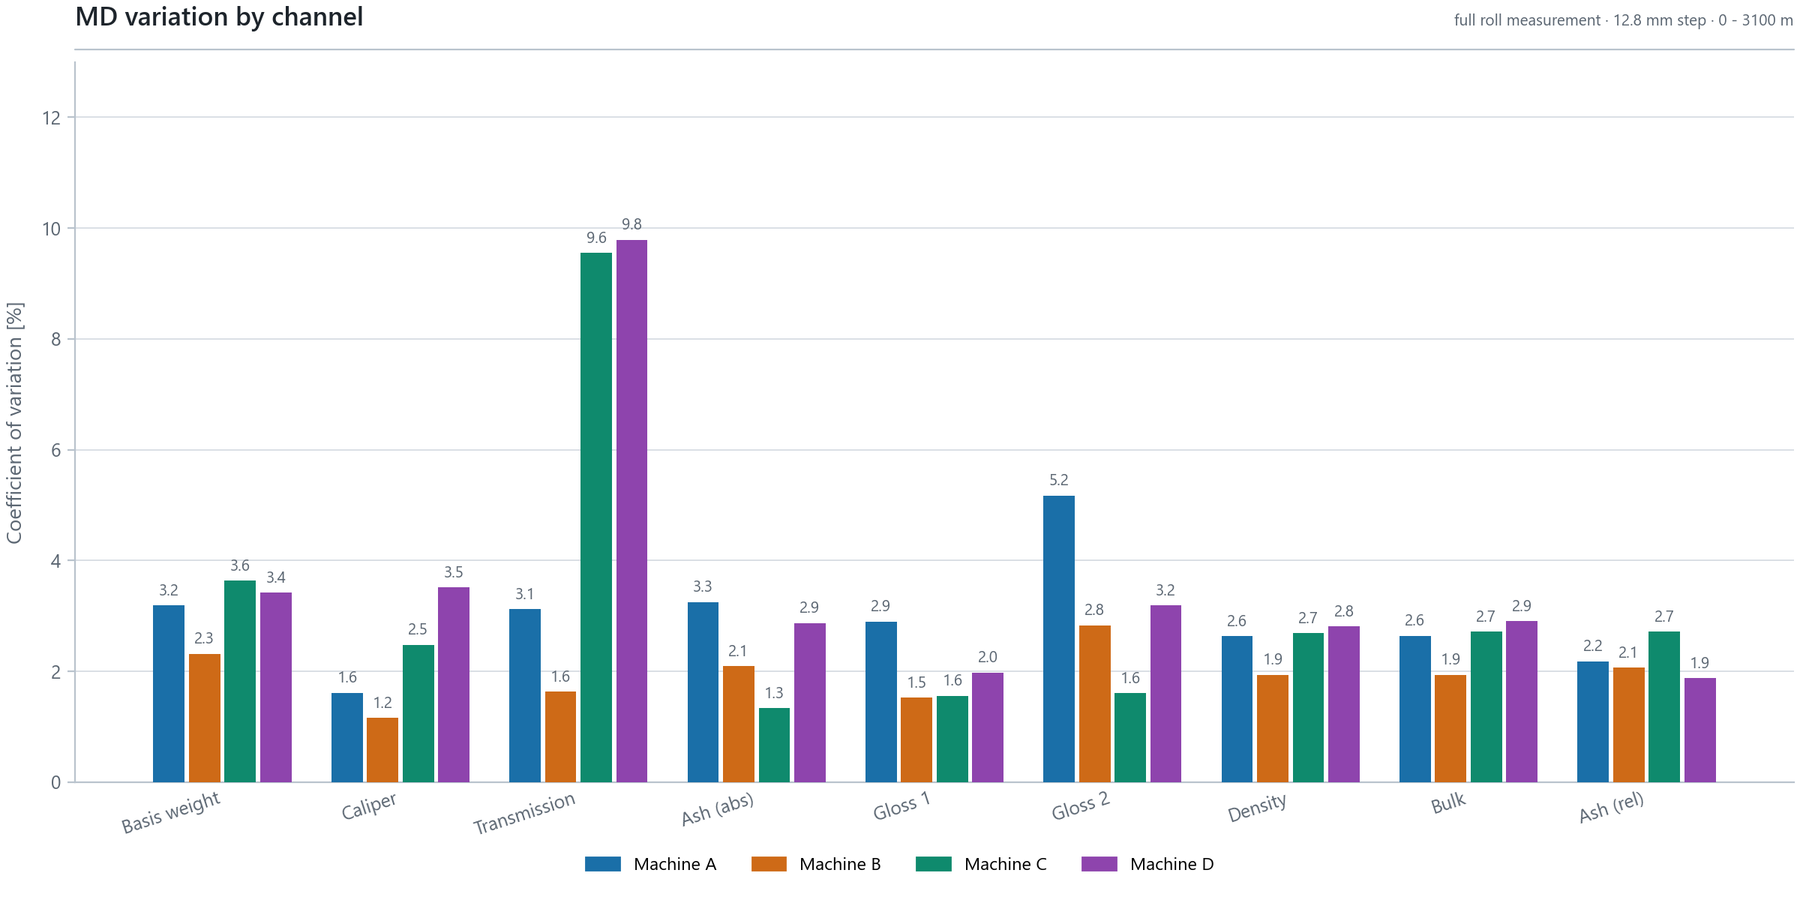
The differences between the machines are considerable. Machine B has the lowest basis-weight variation, with a CV of 2.3 %, compared with 3.2 to 3.6 % for the other machines. Its caliper CV is also the lowest, at 1.2 %.
Machine D has the highest caliper variation, with a CV of 3.5 %, almost three times that of Machine B. However, its basis-weight variation is similar to that of Machine C.
The measurements show clear differences in uniformity, but they do not tell us whether these values are typical for similar paper grades.
Comparing the results with the Tapio measurement archive
Since the 1980s Tapio has accumulated data from thousands of measured paper samples. For a new sample, similar papers are selected from these historical results and the comparison is made within that matched group only: a 70 g/m² paper is compared with other papers of a similar basis weight, measured in the same direction over a similar length, not with the archive as a whole.
For each comparison, reference measurements are selected according to criteria such as basis weight, measurement direction and sample length. The selection can be adjusted depending on the papers and properties being compared. For this example, the reference data includes 241 MD measurements for basis weight and 163 for caliper.
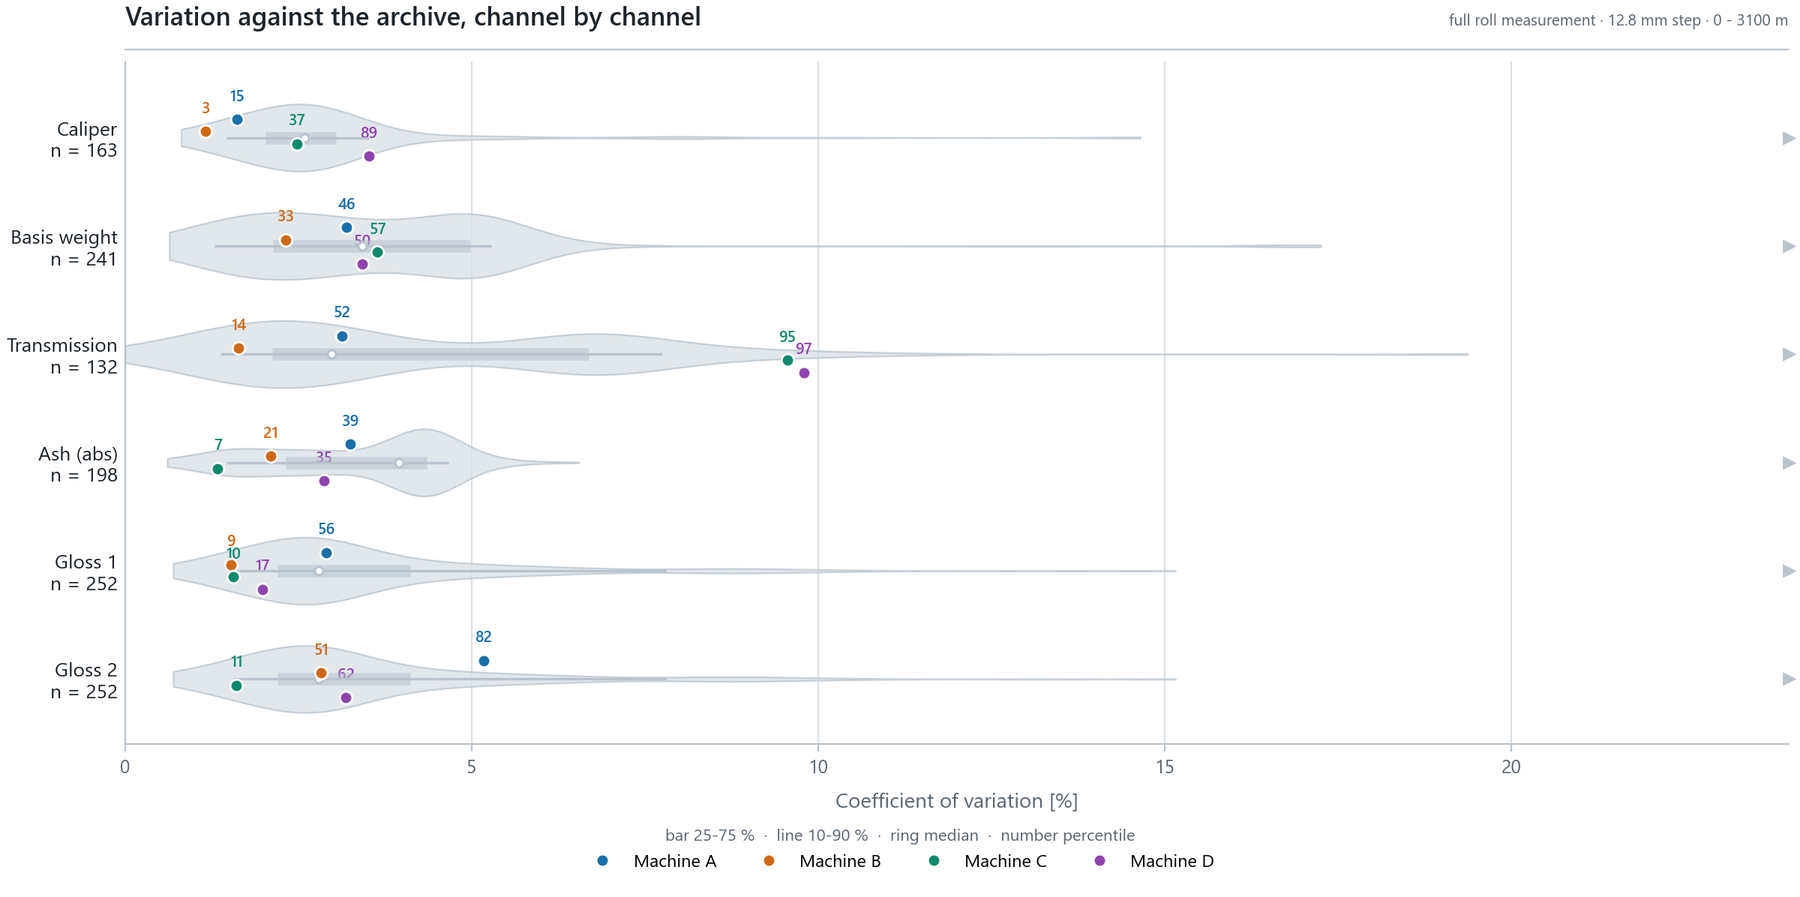
The archive comparison reveals some interesting differences.
Machine B's caliper CV of 1.2 % is at the 3rd percentile of the reference measurements. In other words, only about 3 % of the comparable archived measurements have lower caliper variation.
Machine D, on the other hand, is at the 89th percentile for caliper variation, while its basis-weight variation is close to the archive median.
Machine C is near the middle of the reference distribution for both basis weight and caliper.
This provides more information than comparing only the four machines. It shows which results are relatively high or low compared with previously measured papers.
The archive is not an industry-wide quality standard, and the reference population may contain different grades and production conditions. Nevertheless, it provides useful context for evaluating paper uniformity and comparing different samples with each other.
Looking beyond overall variation
Two papers can have similar CV values but very different variation patterns. One may have gradual changes over hundreds of metres, while another contains a regular variation repeating every few metres.
The Tapio Analysis software can separate these patterns using spectral analysis. Below are the caliper spectra of the four rolls over 0 to 5 cycles per metre, computed with the same settings over the same length.
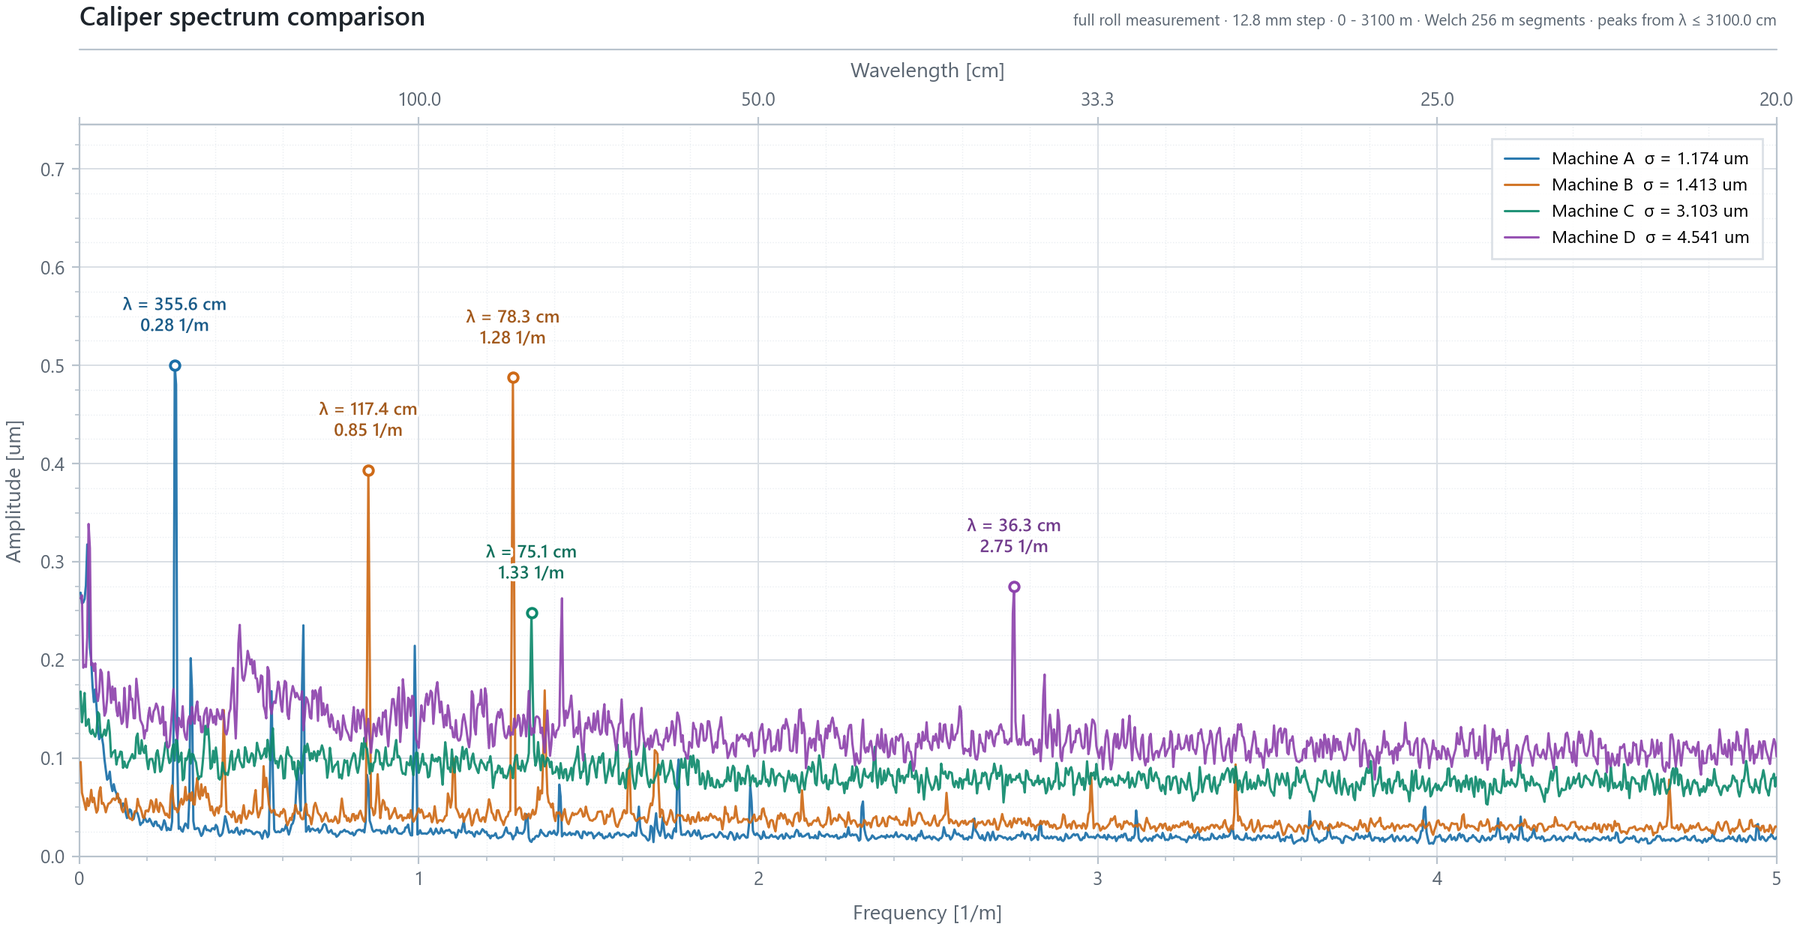
Machine A has a distinct periodic caliper variation with a wavelength of approximately 3.56 m. The same wavelength is also present in the gloss measurements.
Machines C and D have more broadband caliper variation, without similarly dominant periodic components.
These differences are useful when investigating the possible causes of variation. A distinct wavelength can be compared with machine component dimensions and rotational frequencies, while broadband variation indicates that the variation is distributed over a wider range of wavelengths rather than concentrated at distinct periodic components.
Compare your own paper samples
The same methods can be used to compare different paper suppliers, production machines, paper grades or process conditions before and after a modification.
The Tapio Analysis service measures customer-provided samples, compares their properties and variation patterns, and provides a report of the findings. Where suitable reference measurements are available, we also compare the results with our historical archive. The findings are then reviewed together with you: Tapio's specialists go through the data and the open questions with your process and quality engineers in an online meeting, so that the results can be connected to what is known about the machine and the process.
All that is needed are machine-direction rolls or cross-direction strips of each paper to be compared. The sample requirements are described on the sample preparation page, and the sample plan is confirmed with the scope. To discuss your samples, request an analysis or contact us.
Send us your samples
Send us MD rolls or CD strips. You get the measured profiles, a report of the findings and a review with a Tapio specialist.