In paper and board production, calender roll barring is a significant problem which can lead to unscheduled maintenance breaks and visible defects in the end product. Although the exact root cause of barring is not always immediately clear, it can originate from small thickness or basis-weight variations already present in the sheet before calendering, or from mechanical vibration in the calender stack.
Tapio Measurement Technologies provides measurement, analysis and troubleshooting services, for detecting, diagnosing, and ultimately helping to prevent barring problems.
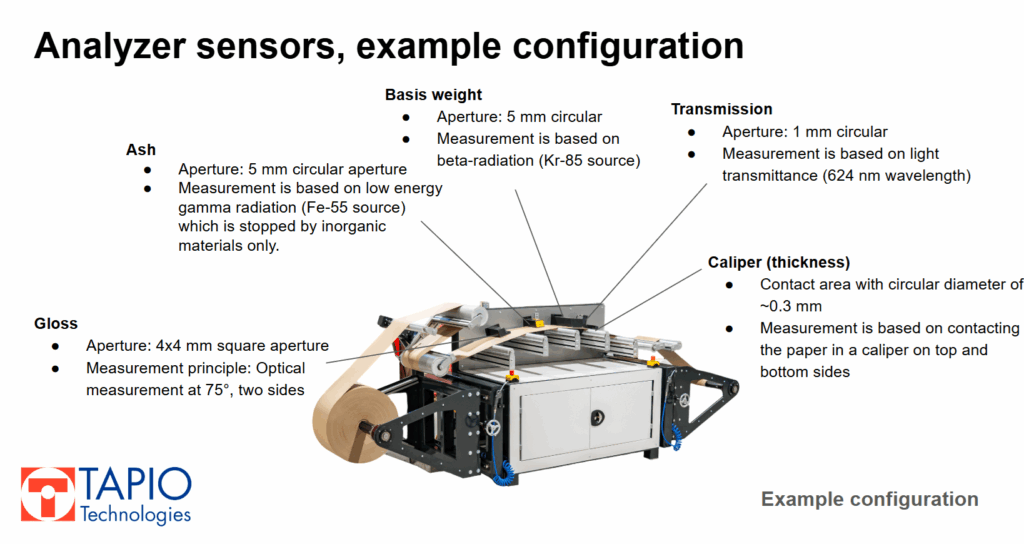
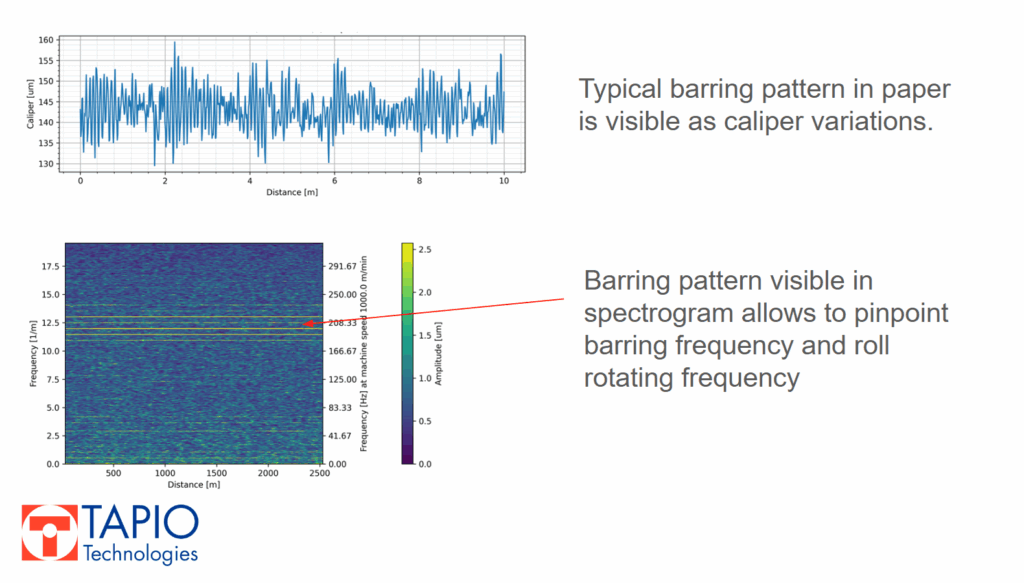
Solving a barring problem starts with identifying its exact frequency. In most cases, barring is clearly visible in the thickness (caliper) data measured with a Tapio Analyzer. As the analyzer runs, it records a continuous machine-direction profile of the sheet with multiple sensors. Each sensor is set up to measure the same physical spot in paper.
Data is obtained from either 20+ CD strips or MD rolls (up to 25 cm wide and 70 cm diameter) comprising up to 4 kilometers of paper or board. After measurement, the data is analyzed with the open-source Tapio Analysis software, enabling studies between the different channels for correlation, spectral analysis, spectral coherence and much more.
All repeating deviations will appear as distinct peaks in the frequency spectrum, and when the rotating speeds or diameters of the rolls are known, the Tapio Analysis software can automatically suggest which rotating machine elements may be the root causes of product variations.
Once the exact barring frequency is identified, it becomes a concrete reference point for the entire investigation. Without this step, troubleshooting remains largely guesswork.
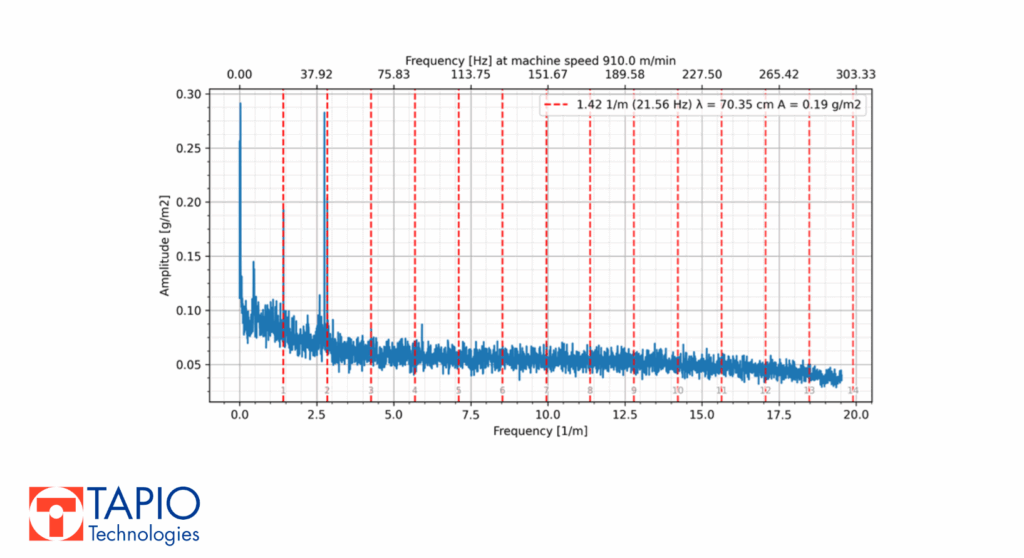
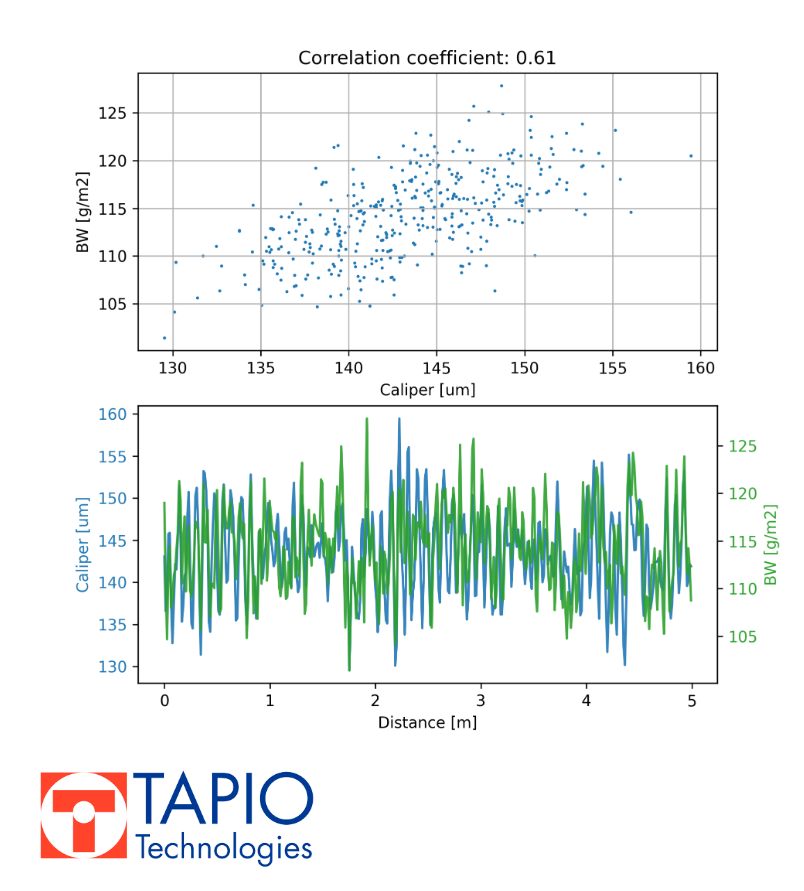
After identifying the exact barring stripe frequency and wavelength (as well as the rotating frequency of the roll that has the barring pattern), Tapio Analysis can be used to compare the data across multiple measurement channels. Overlaying spectra from different sensors quickly reveals whether the same frequency already exists in the base paper and where it could be originating from.
Frequency visible in basis weight suggests a wet-end influence
If the basis-weight channel shows a matching peak, the variations are likely originating at the wet end. In practical terms, this points toward upstream process elements such as pulp consistency, approach flow stability, headbox hydraulics, or forming fabrics. By detecting these early-stage variations, Tapio Analysis helps determine whether corrective actions are needed before the sheet even reaches the calender.
Press section problems are visible in the transmission sensor data
Transmission measurements, based on light passing through the sheet, are highly sensitive to density variations. If the same barring frequency appears in both thickness and transmission data, the press section often plays a role. Non-uniform press nips, uneven felt condition, or roll hardness variations can imprint a repeating density pattern that survives downstream. Tapio Analysis makes it straightforward to compare transmission spectra with caliper data, allowing press-related causes to be identified with confidence.
Ash sensor data can be used to investigate coating evenness
When the ash (or coating reflectance) signal shows the same frequency as the caliper variation, the variation is likely being reinforced or introduced during coating. This may be caused by subtle periodic disturbances in coating formulation, mixing, pumping, or application. Typical root causes include worn pumps, pulsating flow, or misaligned applicator components. Tapio Analysis highlights these coating-level variations and directs attention to the parts of the process where maintenance or tuning is most effective.
Not every mill has the time or resources to perform a detailed barring investigation internally. For these cases, Tapio Measurement Technologies offers Tapio Analysis as a service. If have a barring problem your production line, send us samples and any available process data. We will help you interpret the variation and find where to look first.
By providing samples (MD rolls) to Tapio Measurement Technologies, the customer will receive:
1. Identification and confirmation of the barring frequency
2. Determination of which process stages show likely matching variations
3. A clear written report with figures and a meeting with Tapio experts to look at the data in detail and discuss potential corrective actions